Wind, Hydroelectricity See Bumps in New Chart of Americans’ 2011 Energy Use
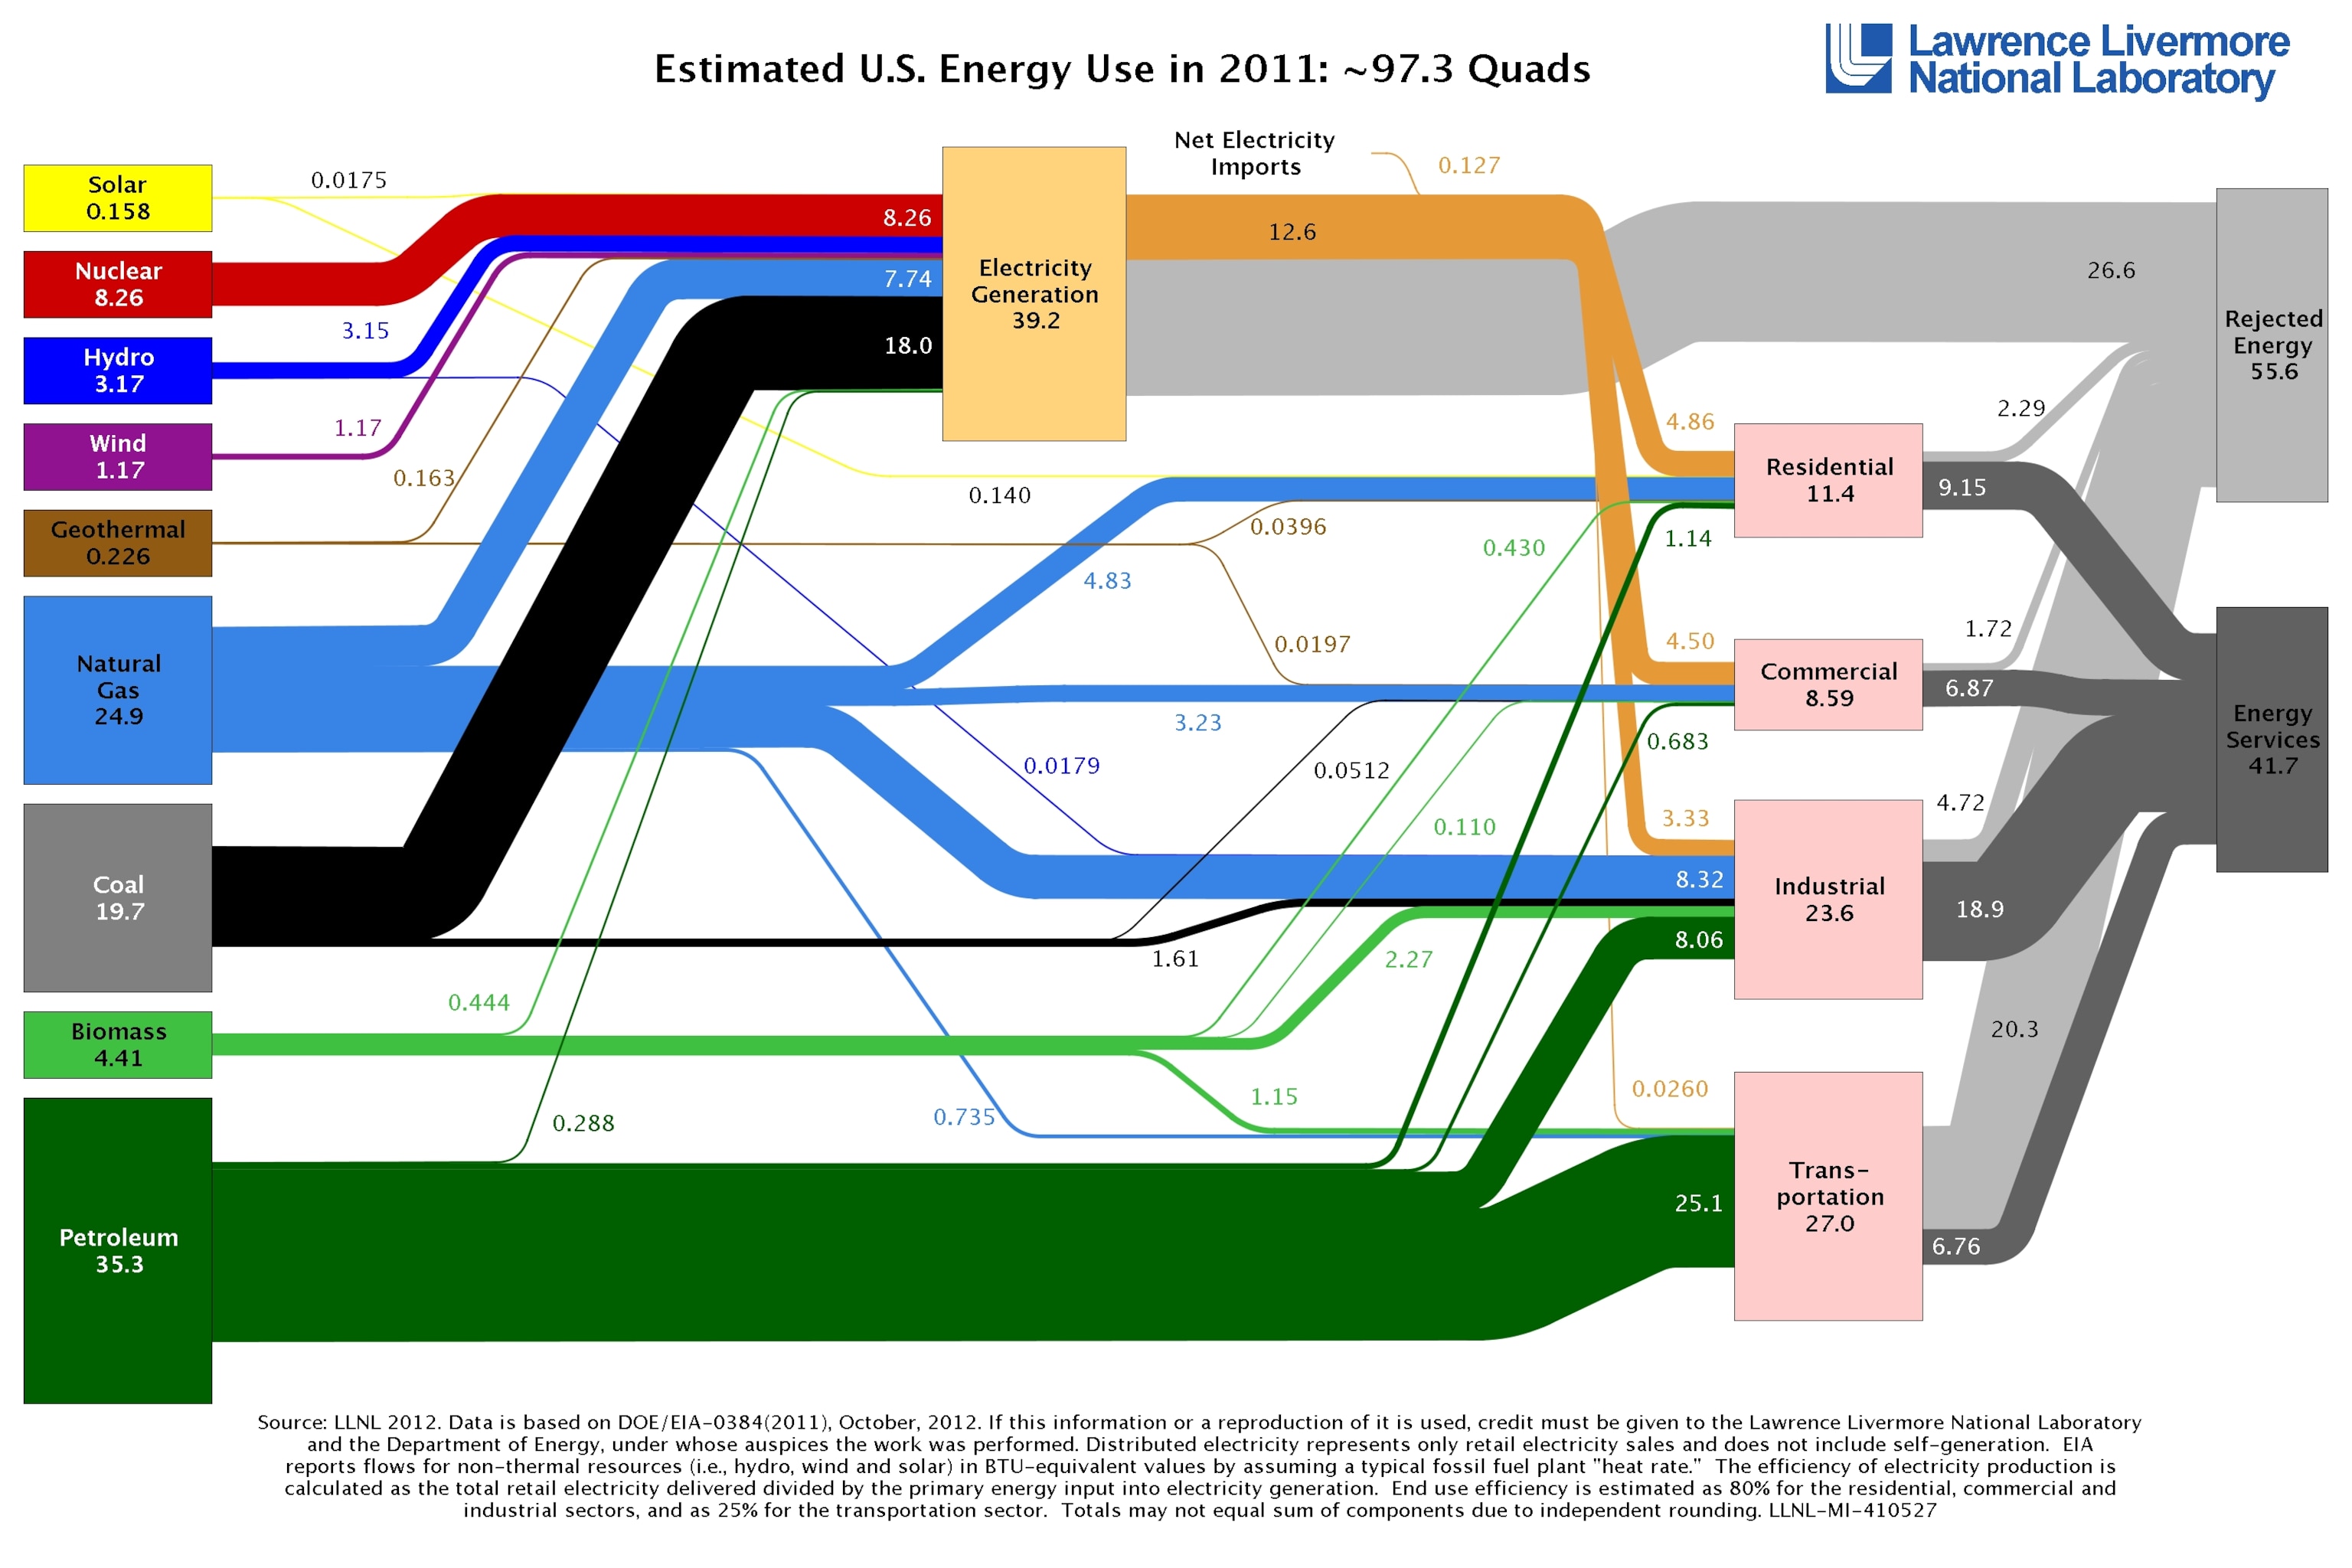
A new analysis of American energy use in 2011 shows a shift to higher-efficiency technologies, though most energy use in the United States remains tied to coal, natural gas and petroleum (click here to see an enlarged version).
The flow chart analysis, which was released by Lawrence Livermore National Laboratory (LLNL), and was created using data from the Energy Information Administration (EIA), shows that Americans last year used 97.3 quadrillion BTU (quads), a slight drop from 2010.
The majority of energy use was for electricity generation, with wind power seeing the biggest jump between 2010 and 2011, increasing 27 percent. Hydroelectricity increased 26 percent. Livermore analysts attributed these changes to an increase in the number of wind farms and to maximized output from hydroelectric dams in the western U.S., thanks to high precipitation levels.
Use of natural gas also increased slightly. “Sustained low natural gas prices have prompted a shift from coal to gas in the electricity generating sector,” Livermore analyst A.J. Simon said in a press release. “Sustained high oil prices have likely driven the decline in oil use over the past 5 years as people choose to drive less and purchase automobiles that get more miles per gallon.”
High oil prices have also led to changes in home heating habits, the EIA noted in its annual Winter Fuels Outlook this month. More American households, particularly in the Northeast, are turning to wood as fuel for home heating.
Wood use is included in the biomass section of the Livermore chart. LLNL’s Anne Stark notes that biomass is also used in the transportation sector for ethanol production and that a few power plants use wood and forest residue to produce electricity.
