How Gulf Spill Estimates Got It So Wrong
How much oil spilled into the Gulf last year? An engineer explains how he caused estimates to rise sharply practically overnight. Video.
Marine oil spills are usually measured by the amount of oil floating on the surface. But the BP spill in the Gulf of Mexico—from a deep-sea well required a different approach. Find out how one fluid-dynamics expert caused estimates to rise sharply practically overnight.
© 2011 National Geographic; partially funded by NSF; field producing and videography by Fritz Faerber
RELATED
· Gulf Oil Spill Anniversary News and Pictures
· Gulf Oil Plumes Still a Threat?
UNEDITED TRANSCRIPT
ONE OF THE KEY QUESTIONS IN THE 2010 GULF OIL SPILL WILL LIKELY NEVER BE COMPLETELY ANSWERED – EXACTLY HOW MUCH OIL SURGED INTO THE SEA?
ESTIMATES RANGED IN THE EARLY DAYS OF THE SPILL – WITH THE COAST GUARD AT FIRST SAYING JUST 1,000 BARRELS A DAY WERE LEAKING AND THEN RAISING THAT TO 5,000. BUT ON MAY 12TH, 2010, THAT NUMBER SOARED DRAMATICALLY. THE REASON? A FLUID DYNAMICS EXPERT AT PURDUE UNIVERSITY GOT TO SEE VIDEO OF THE RUPTURED WELL AND SAW THAT THE NUMBERS CLEARLY WERE NOT ADDING UP.
SOT: Steve Wereley, Professor of Mechanical Engineering, Purdue University
“Using a very simple analysis, procedure, I was able to conclude that the flow rate of the oil was considerably higher than previously estimated.”
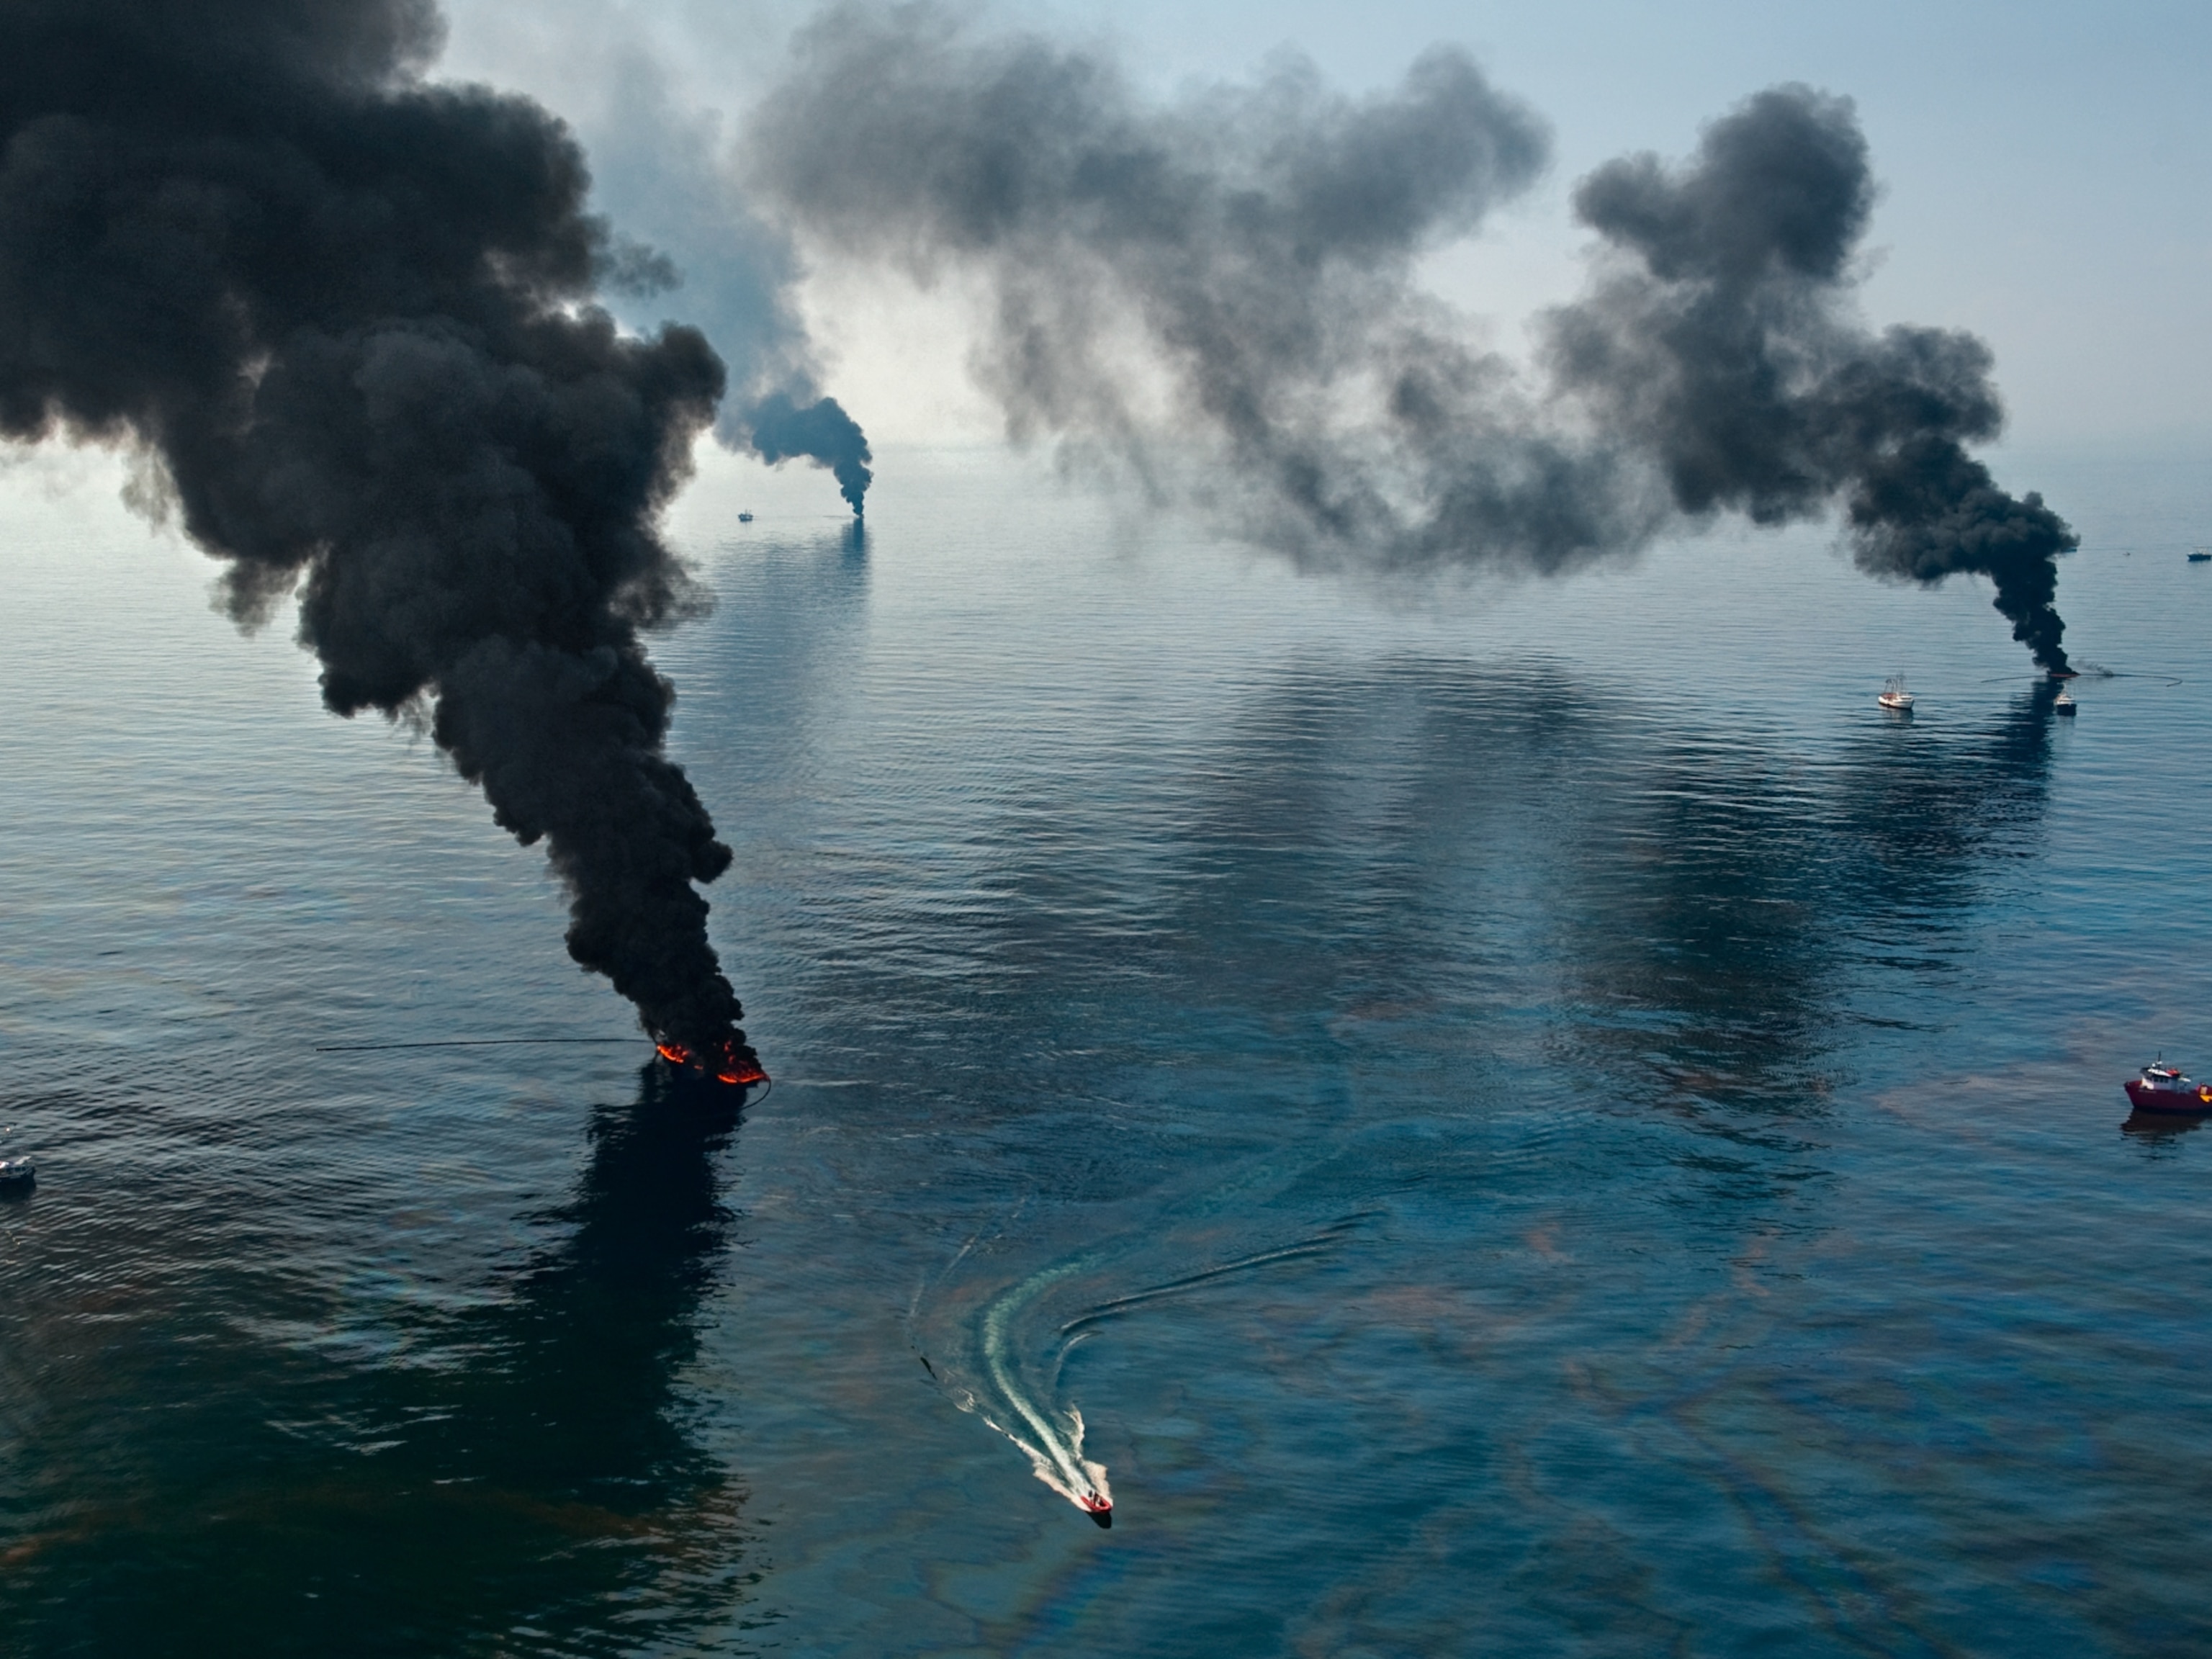
BP AND OUTSIDE EXPERTS BASED THE FIRST ESTIMATES ON THE SIZE OF THE OIL SLICK ON THE SURFACE. IT’S A LONG-USED TECHNIQUE FOR ESTIMATING A SPILL…
SOT: Wereley
“The oil was being discharged from a deep water well, which was almost a mile under the surface of the ocean and as the oil rises from the bottom, from the sea floor where the well had broken to the surface, it decomposes or breaks up into small droplets and the smaller the droplets are, the slower they come up. And, in fact, at some size, they don’t all make it to the surface.”
BUT WITH VIDEO OF THE oil pouring from THE BROKEN BLOWOUT PREVENTER, ALONG WITH FLUID DYNAMICS SCIENCE, WERELEY COULD CALCULATE THE RATE OF OIL AND GAS FLOWING FROM THE WELL – A NUMBER HE PUT AT around 70,000 BARRELS A DAY. TO CALCULATE THIS HE SIMPLY WENT TO THE VIDEO.
SOT: Wereley
“What you see is clouds, you’ll see puffs or billows of fluid. I the fluids mechanics business we call those turbulent coherent structures” …. "Here, this is called the phlange, and we can compare this to engineering drawings, of the blowout preventer, which says this phlange is 43 inches in diameter. And if I can measure this in pixels, I have a correlation of how many pixels across this is to real space: 43 inches, and that tells me then if I go up to the flow and I measure that the turbulent coherent structure moves 100 pixels, that gives me a way to correlate that to how far it's moved in reality."
WERELEY’S ESTIMATES MADE HEADLINES AND LED TO AN INVITATION TO TESTIFY BEFORE CONGRESS IN MAY, 2010.
IN THE MONTHS FOLLOWING THAT TESTIMONY, WERELEY WORKED WITH OTHER SCIENTISTS, AND THE OFFICIAL “FLOW RATE TECHNICAL GROUP” IN MAY, 2011 ISSUED A FINAL ESTIMATE that topped at around 62,000 BARRELS OF OIL PER DAY LEAKED FROM THE well, DECLINING TO 53,000 BARRELS A DAY BY THE TIME THE WELL WAS CAPPED 87 DAYS AFTER THE BLOWOUT.
WITH THOSE NUMBERS, THE SCIENTIFIC TEAM ESTIMATES NEARLY 5 MILLION BARRELS OF OIL SPILLED INTO THE GULF OF MEXICO.
WERELEY HAS CREATED A WEB SITE SHOWING MORE THAN 160 HOURS OF VIDEO OF THE SPILL AT OILSPILLHUB-DOT-ORG.


