How National Geographic Has Mapped Hurricanes Over 130 Years
Line drawings based on eyewitness accounts dominated hurricane mapping in the magazine’s early days.
The story of cartography at National Geographic begins with a storm.
Nicknamed “the Great White Hurricane,” the blizzard shut down cities along the Atlantic coastline for four days in the spring of 1888. That October, the magazine launched with its first issue and its first map: a footprint-shaped outline of the snowstorm wrapping from New York to Bermuda and wandering in wavy lines up to Canada. The article’s author was Edward Everett Hayden, a meteorologist and founding member of the National Geographic Society who helped establish the magazine’s long legacy of mapping natural disasters.
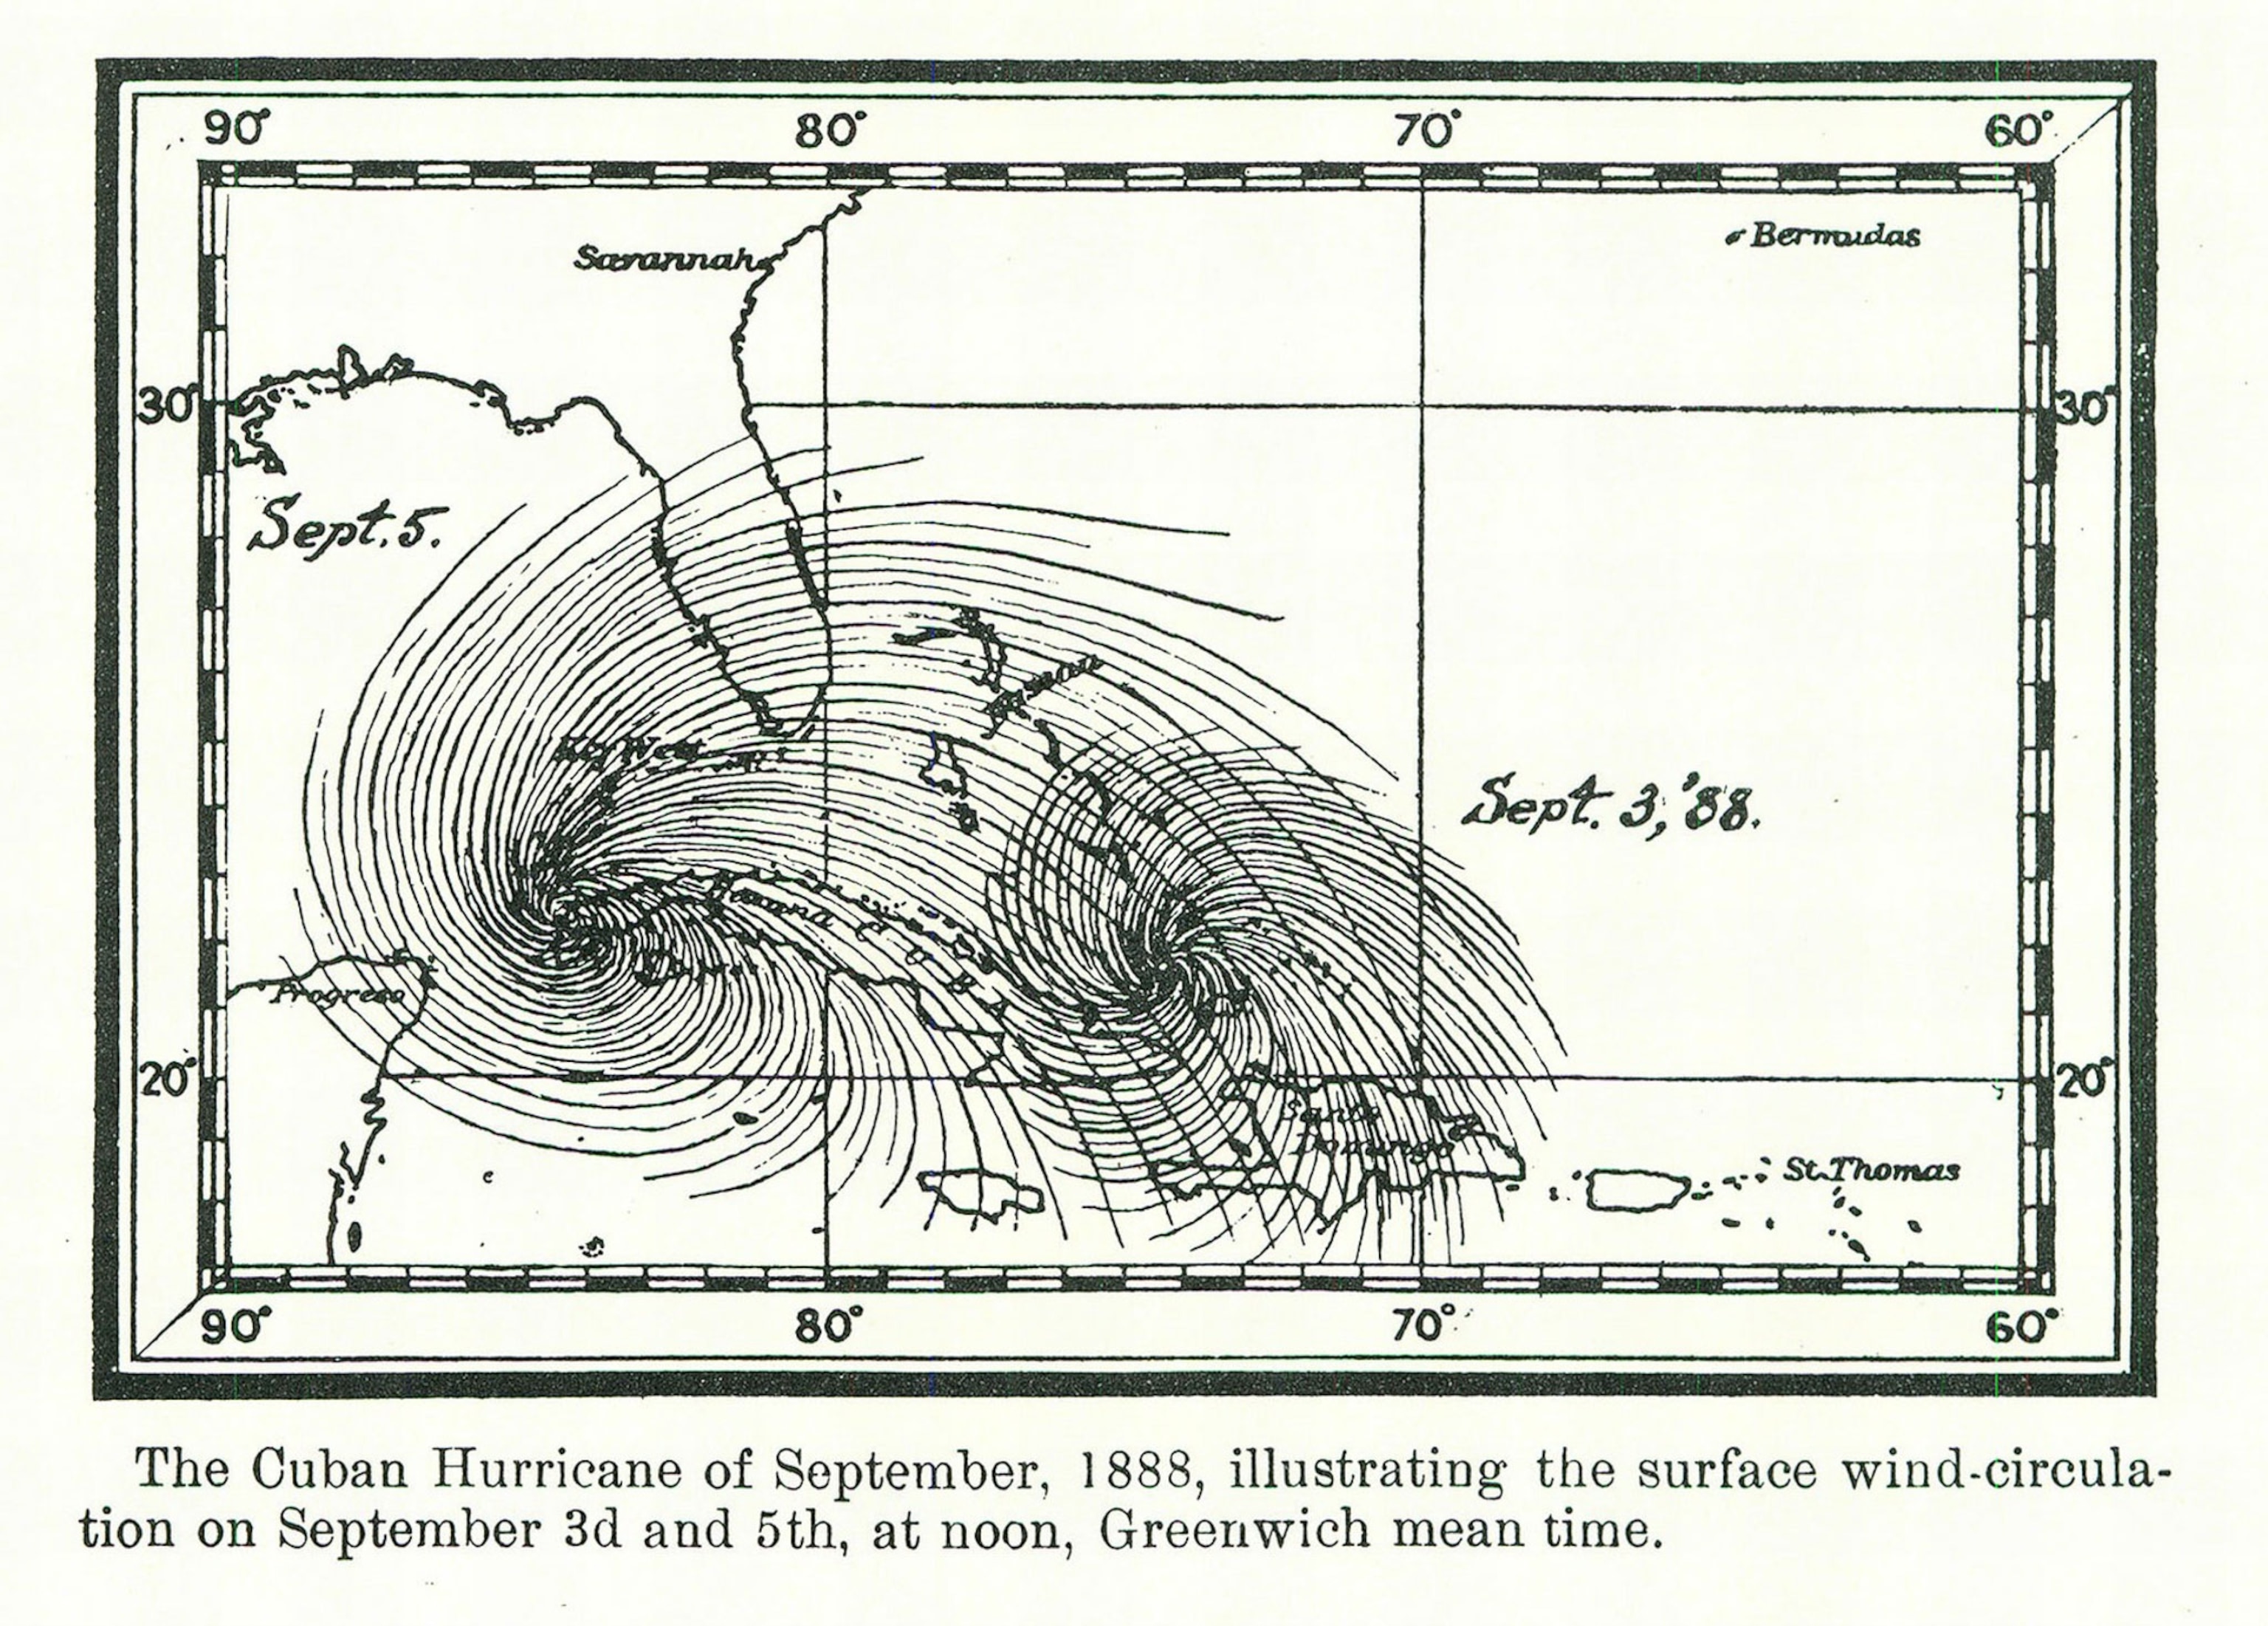
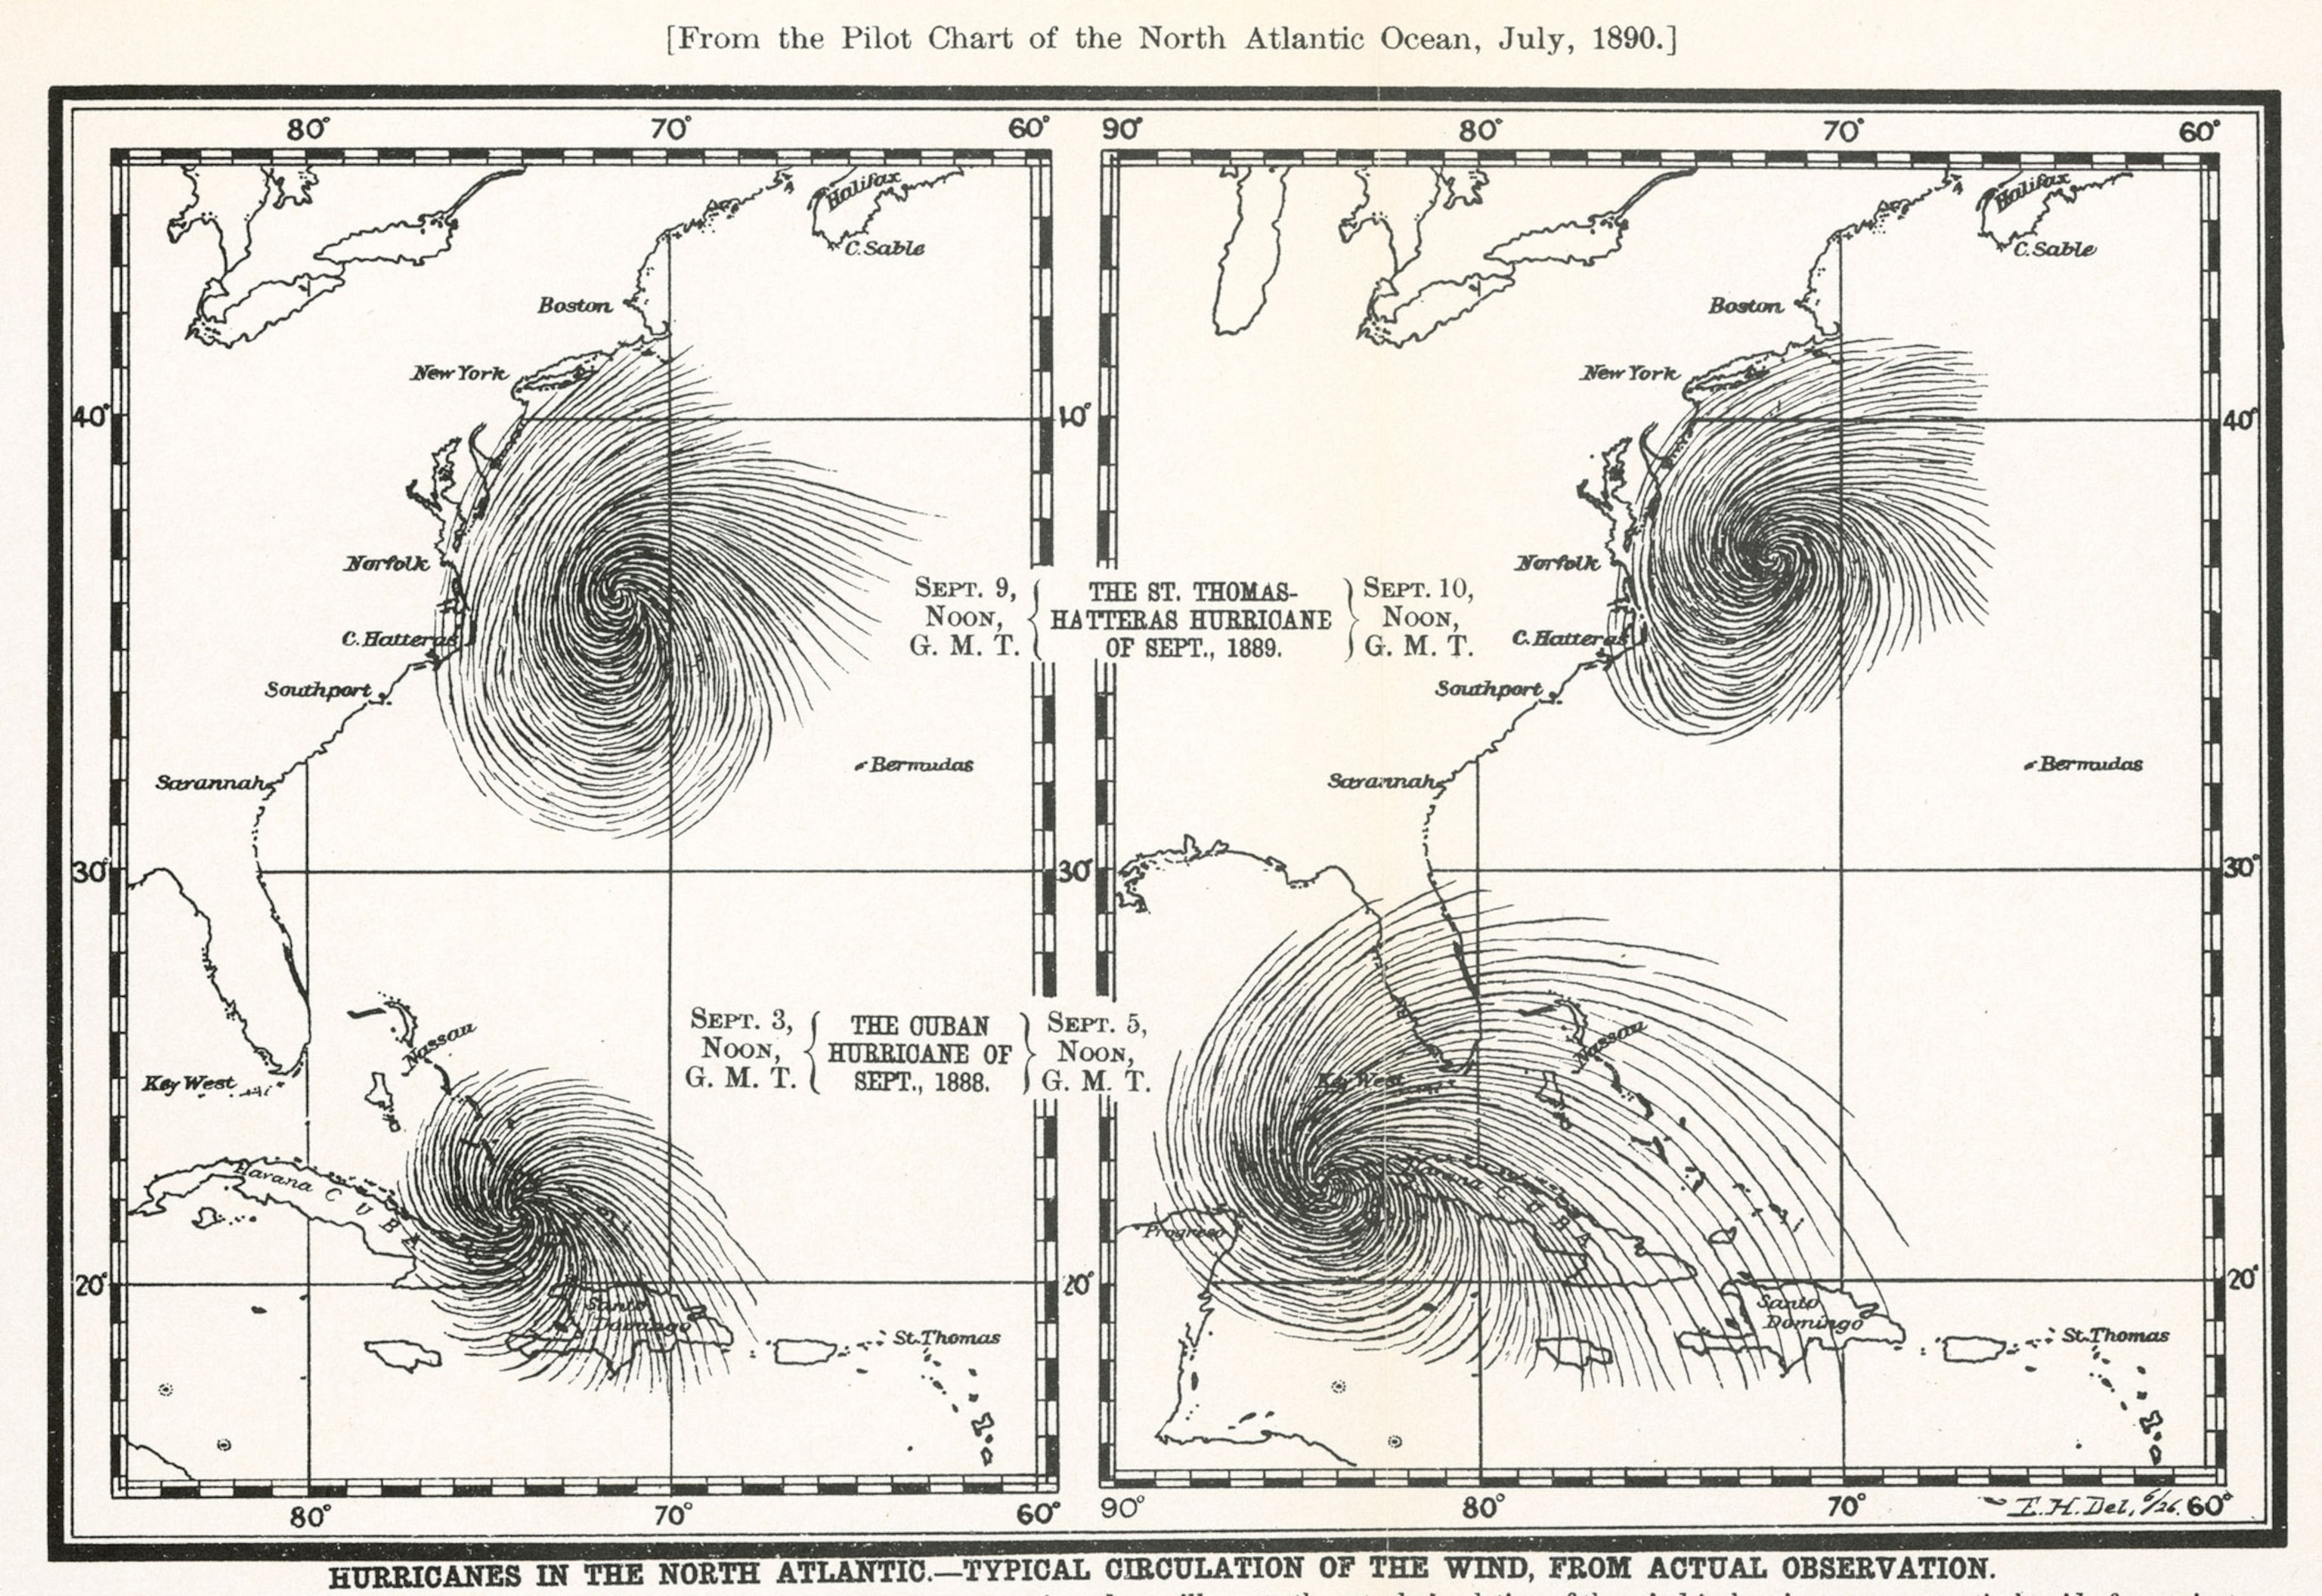
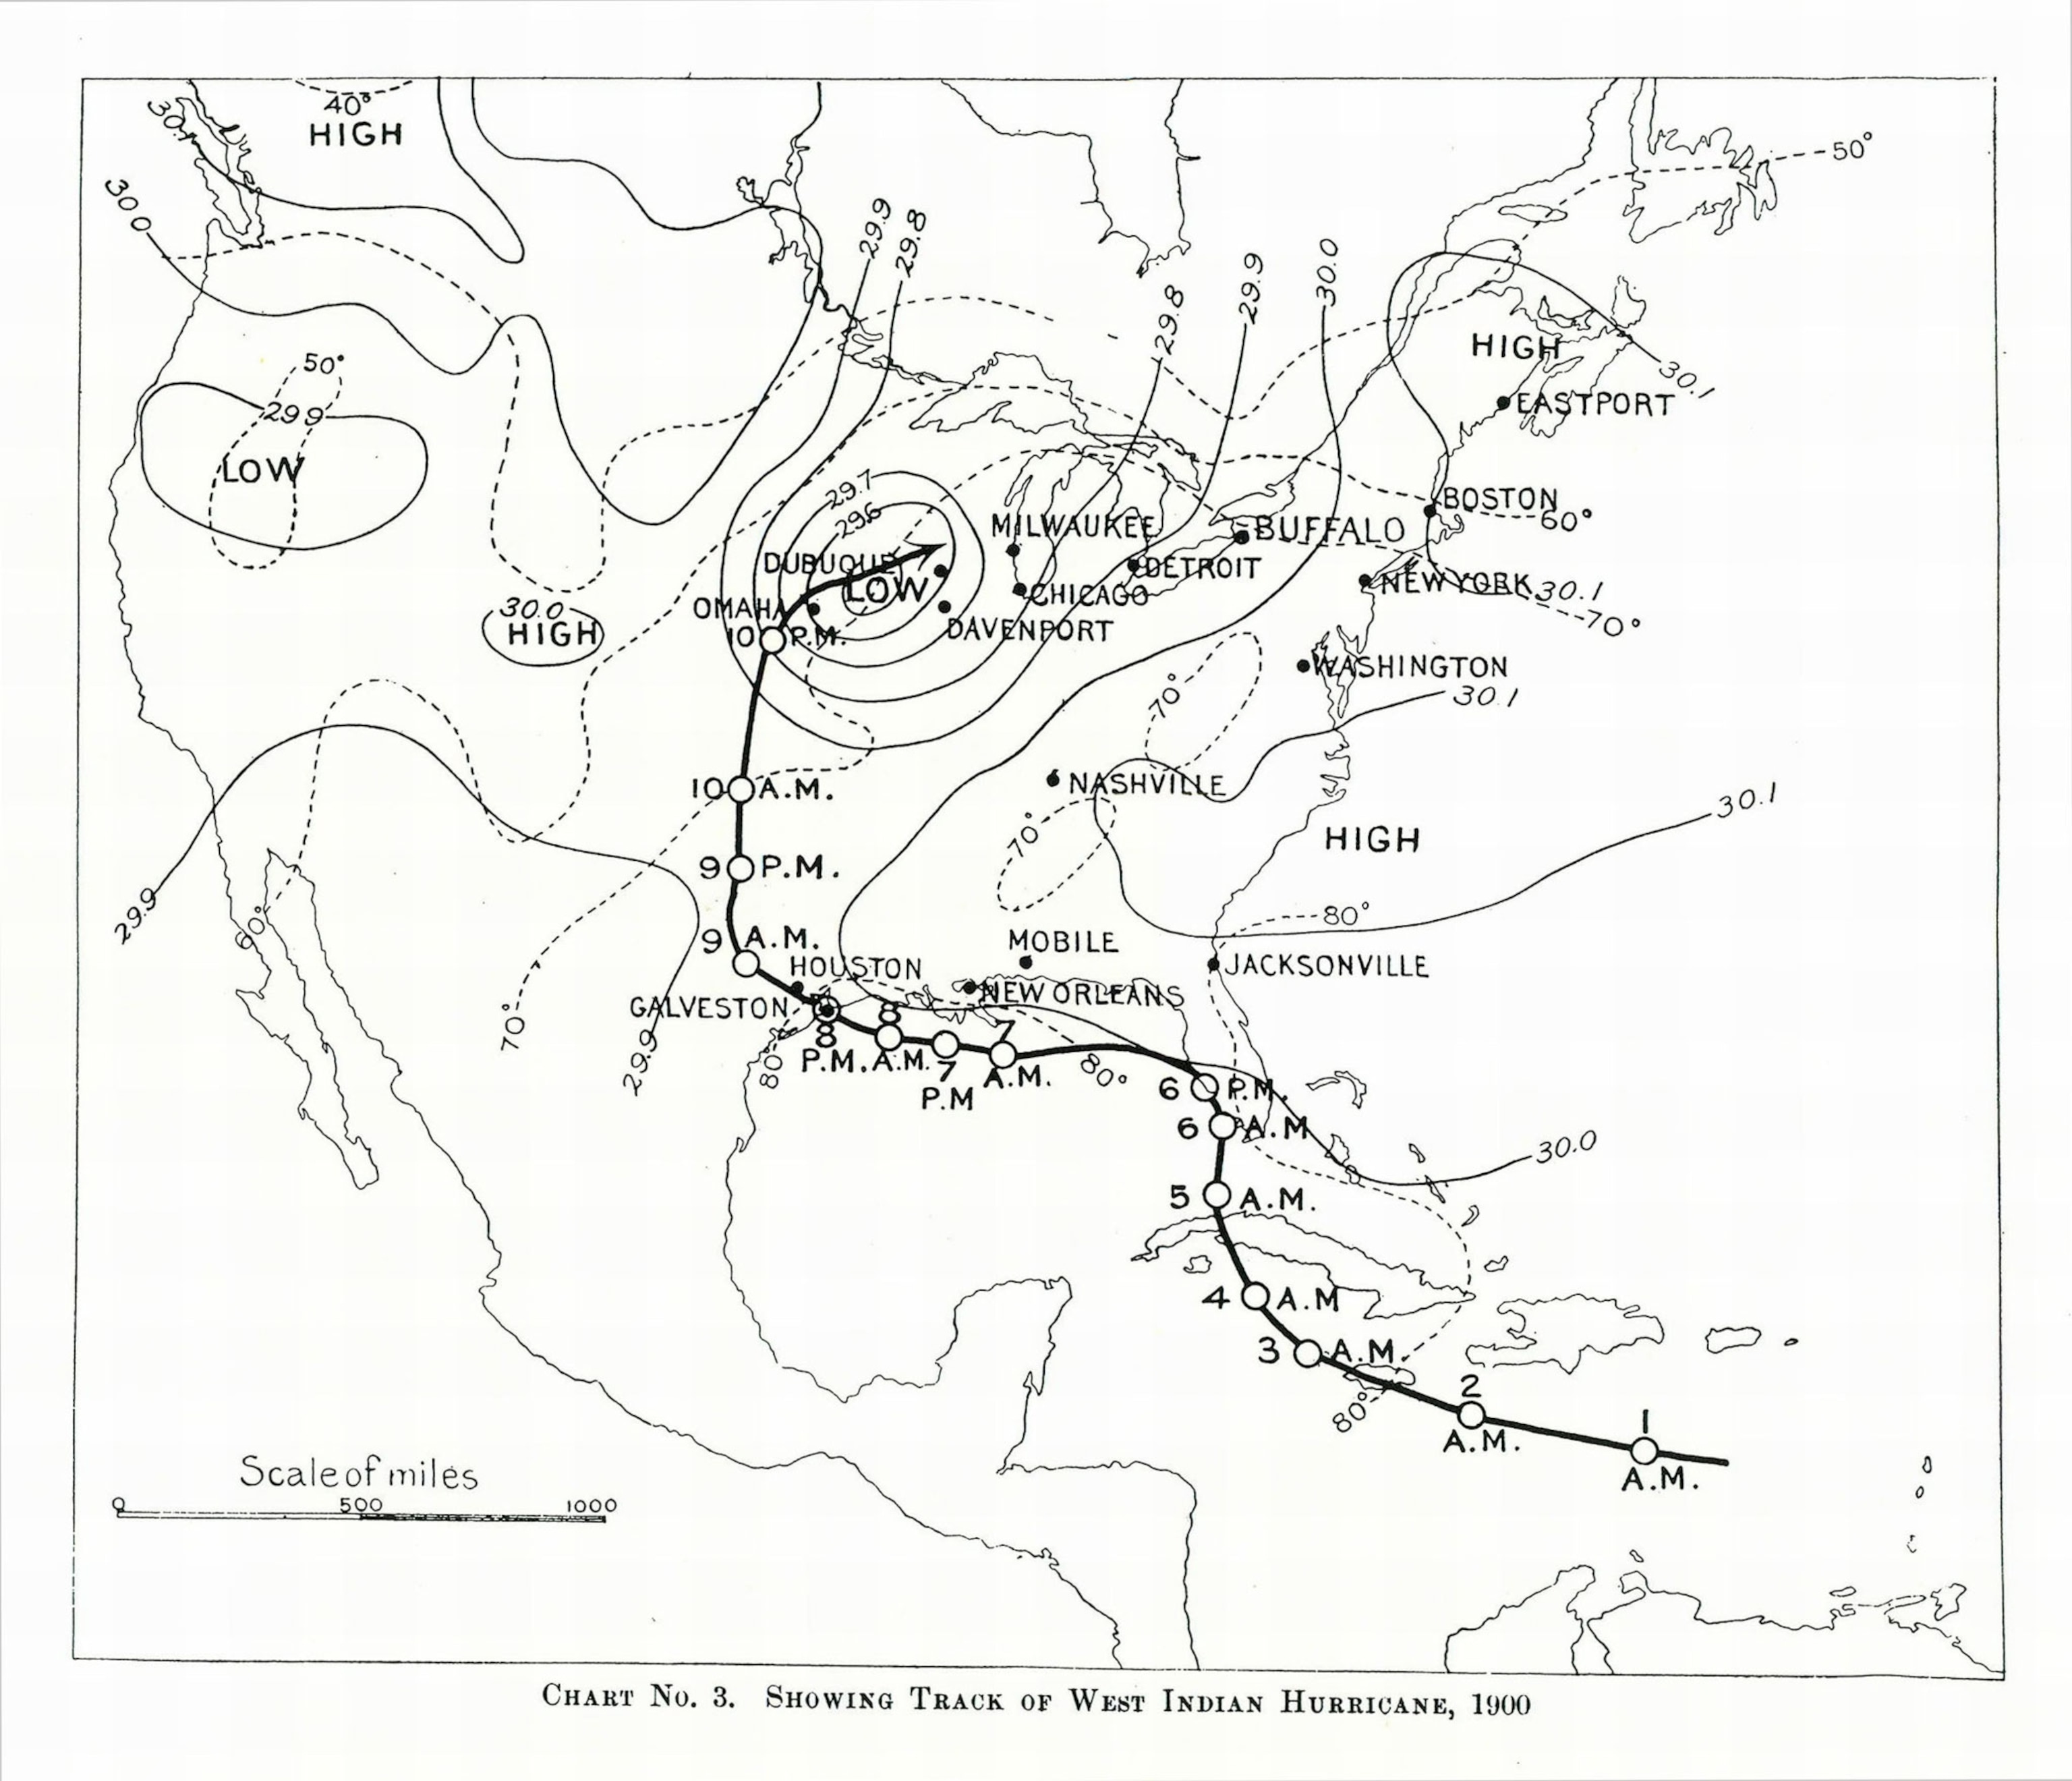
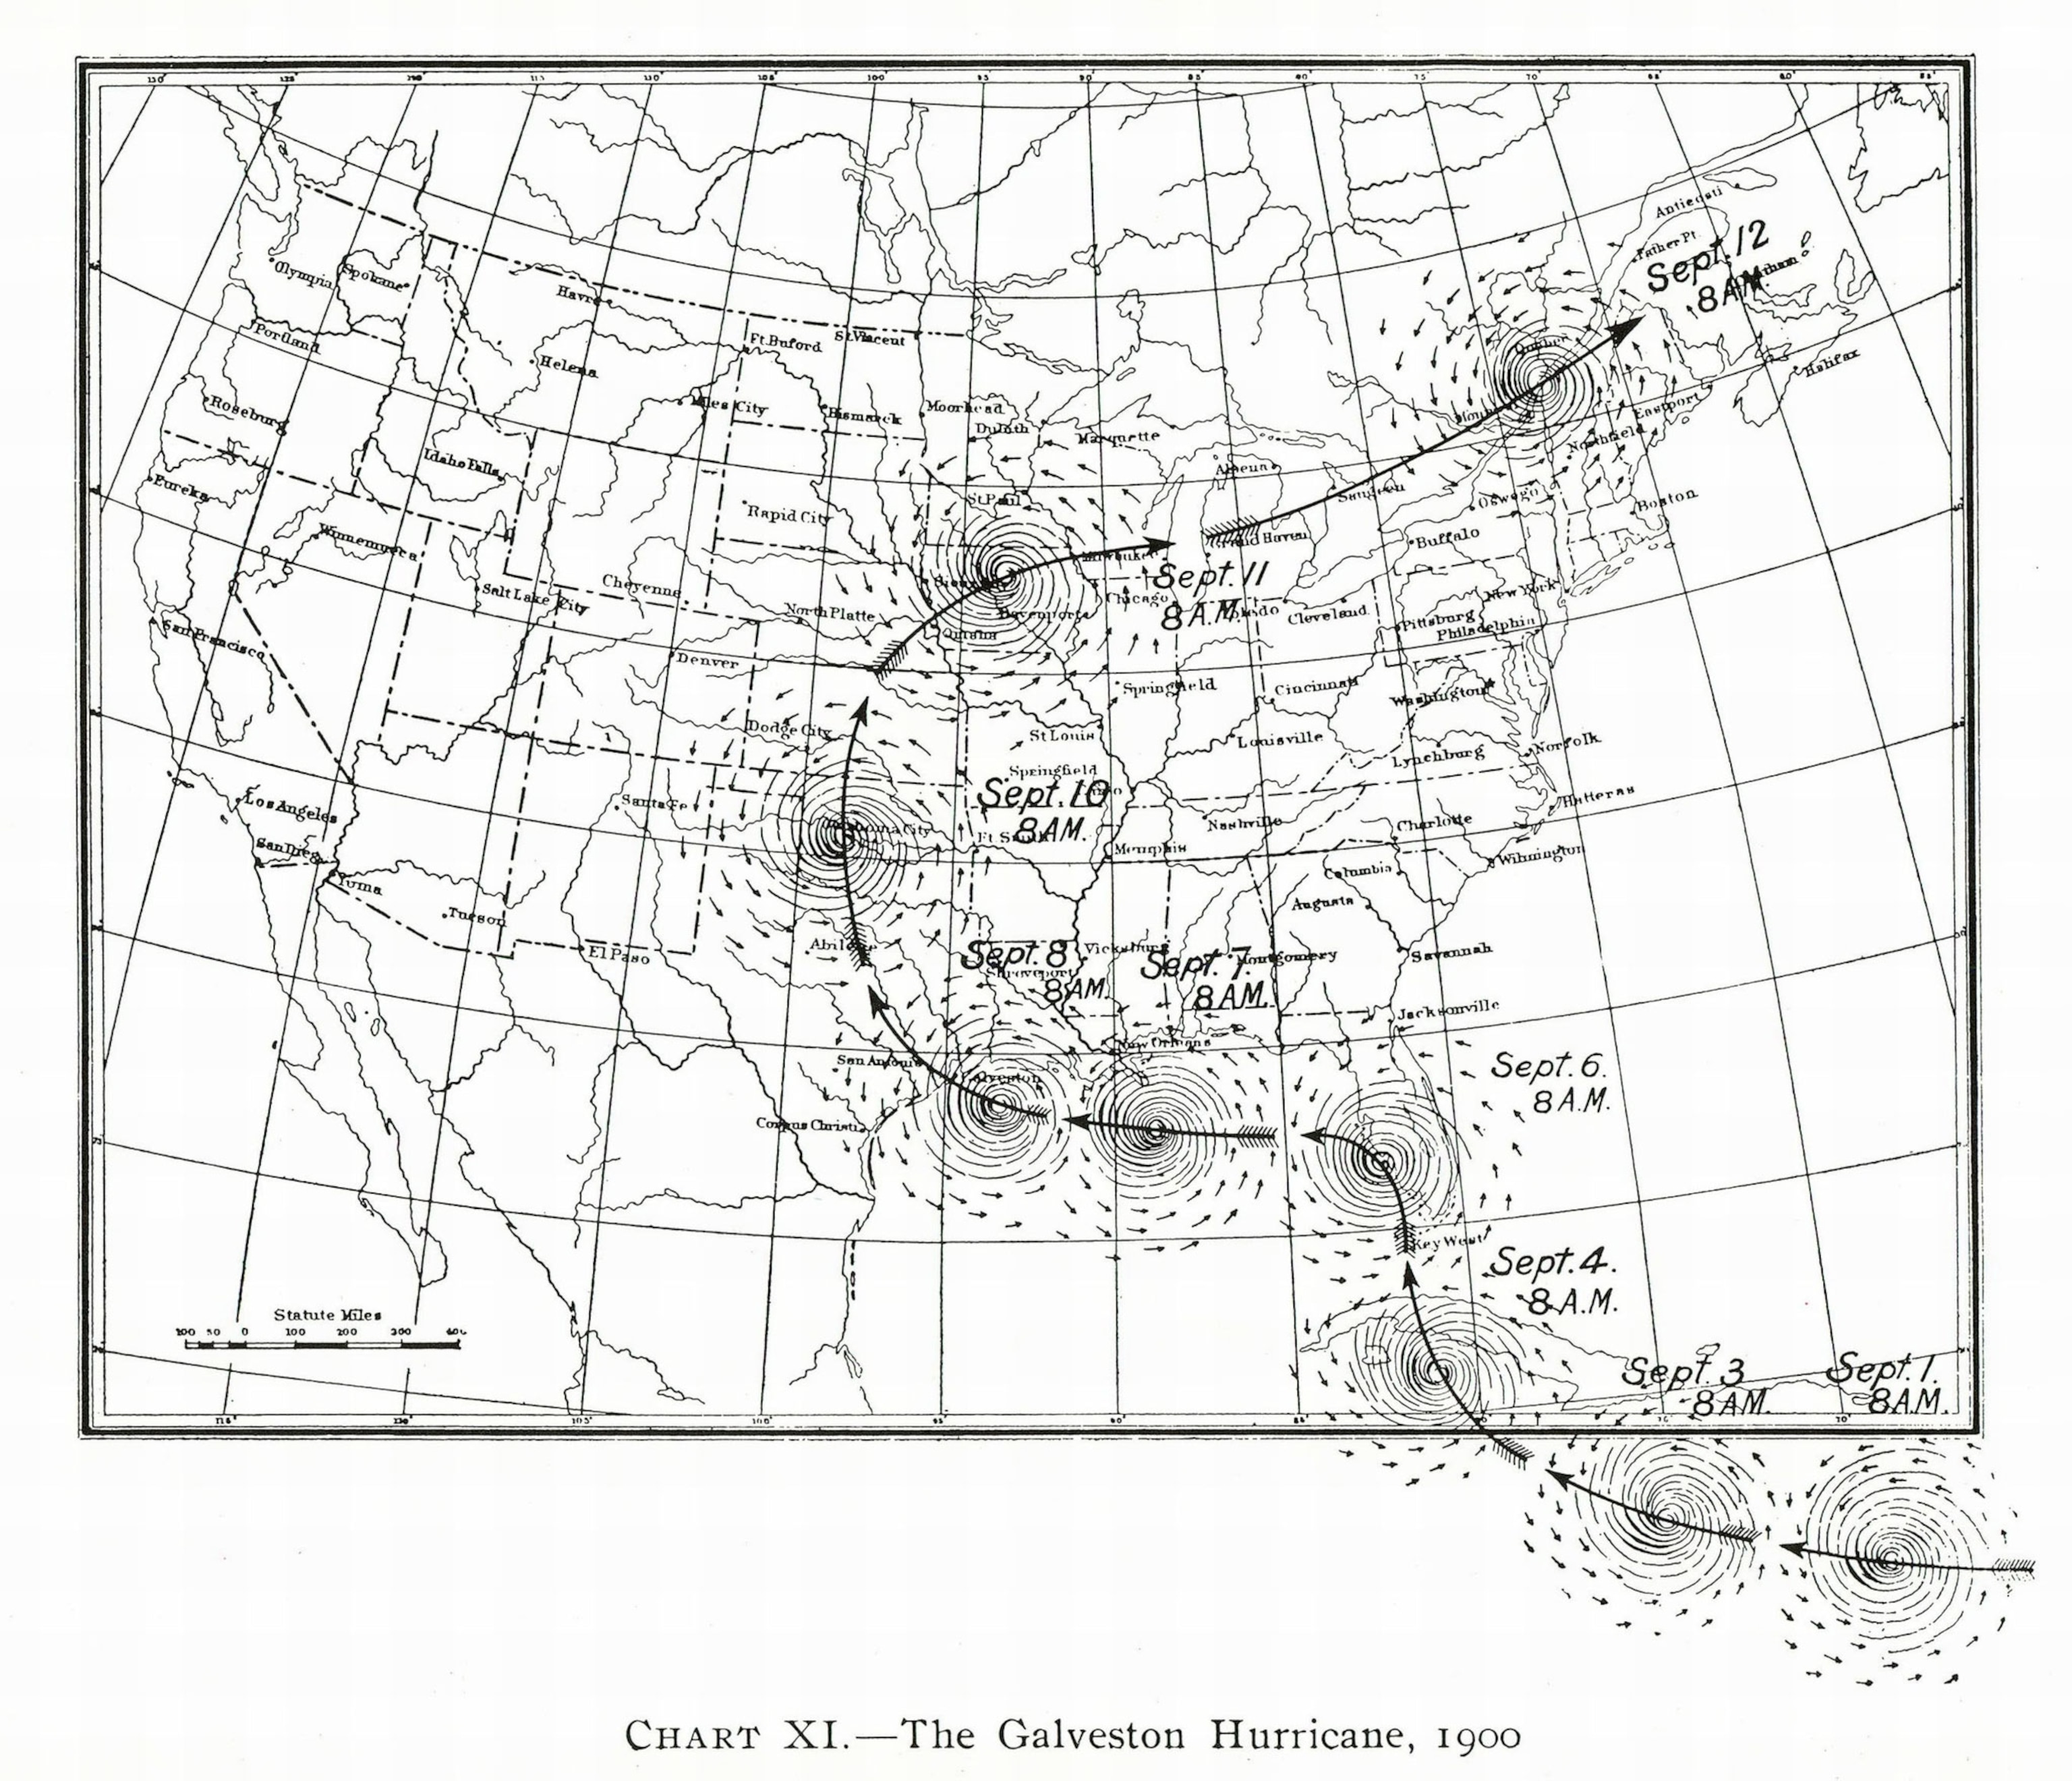
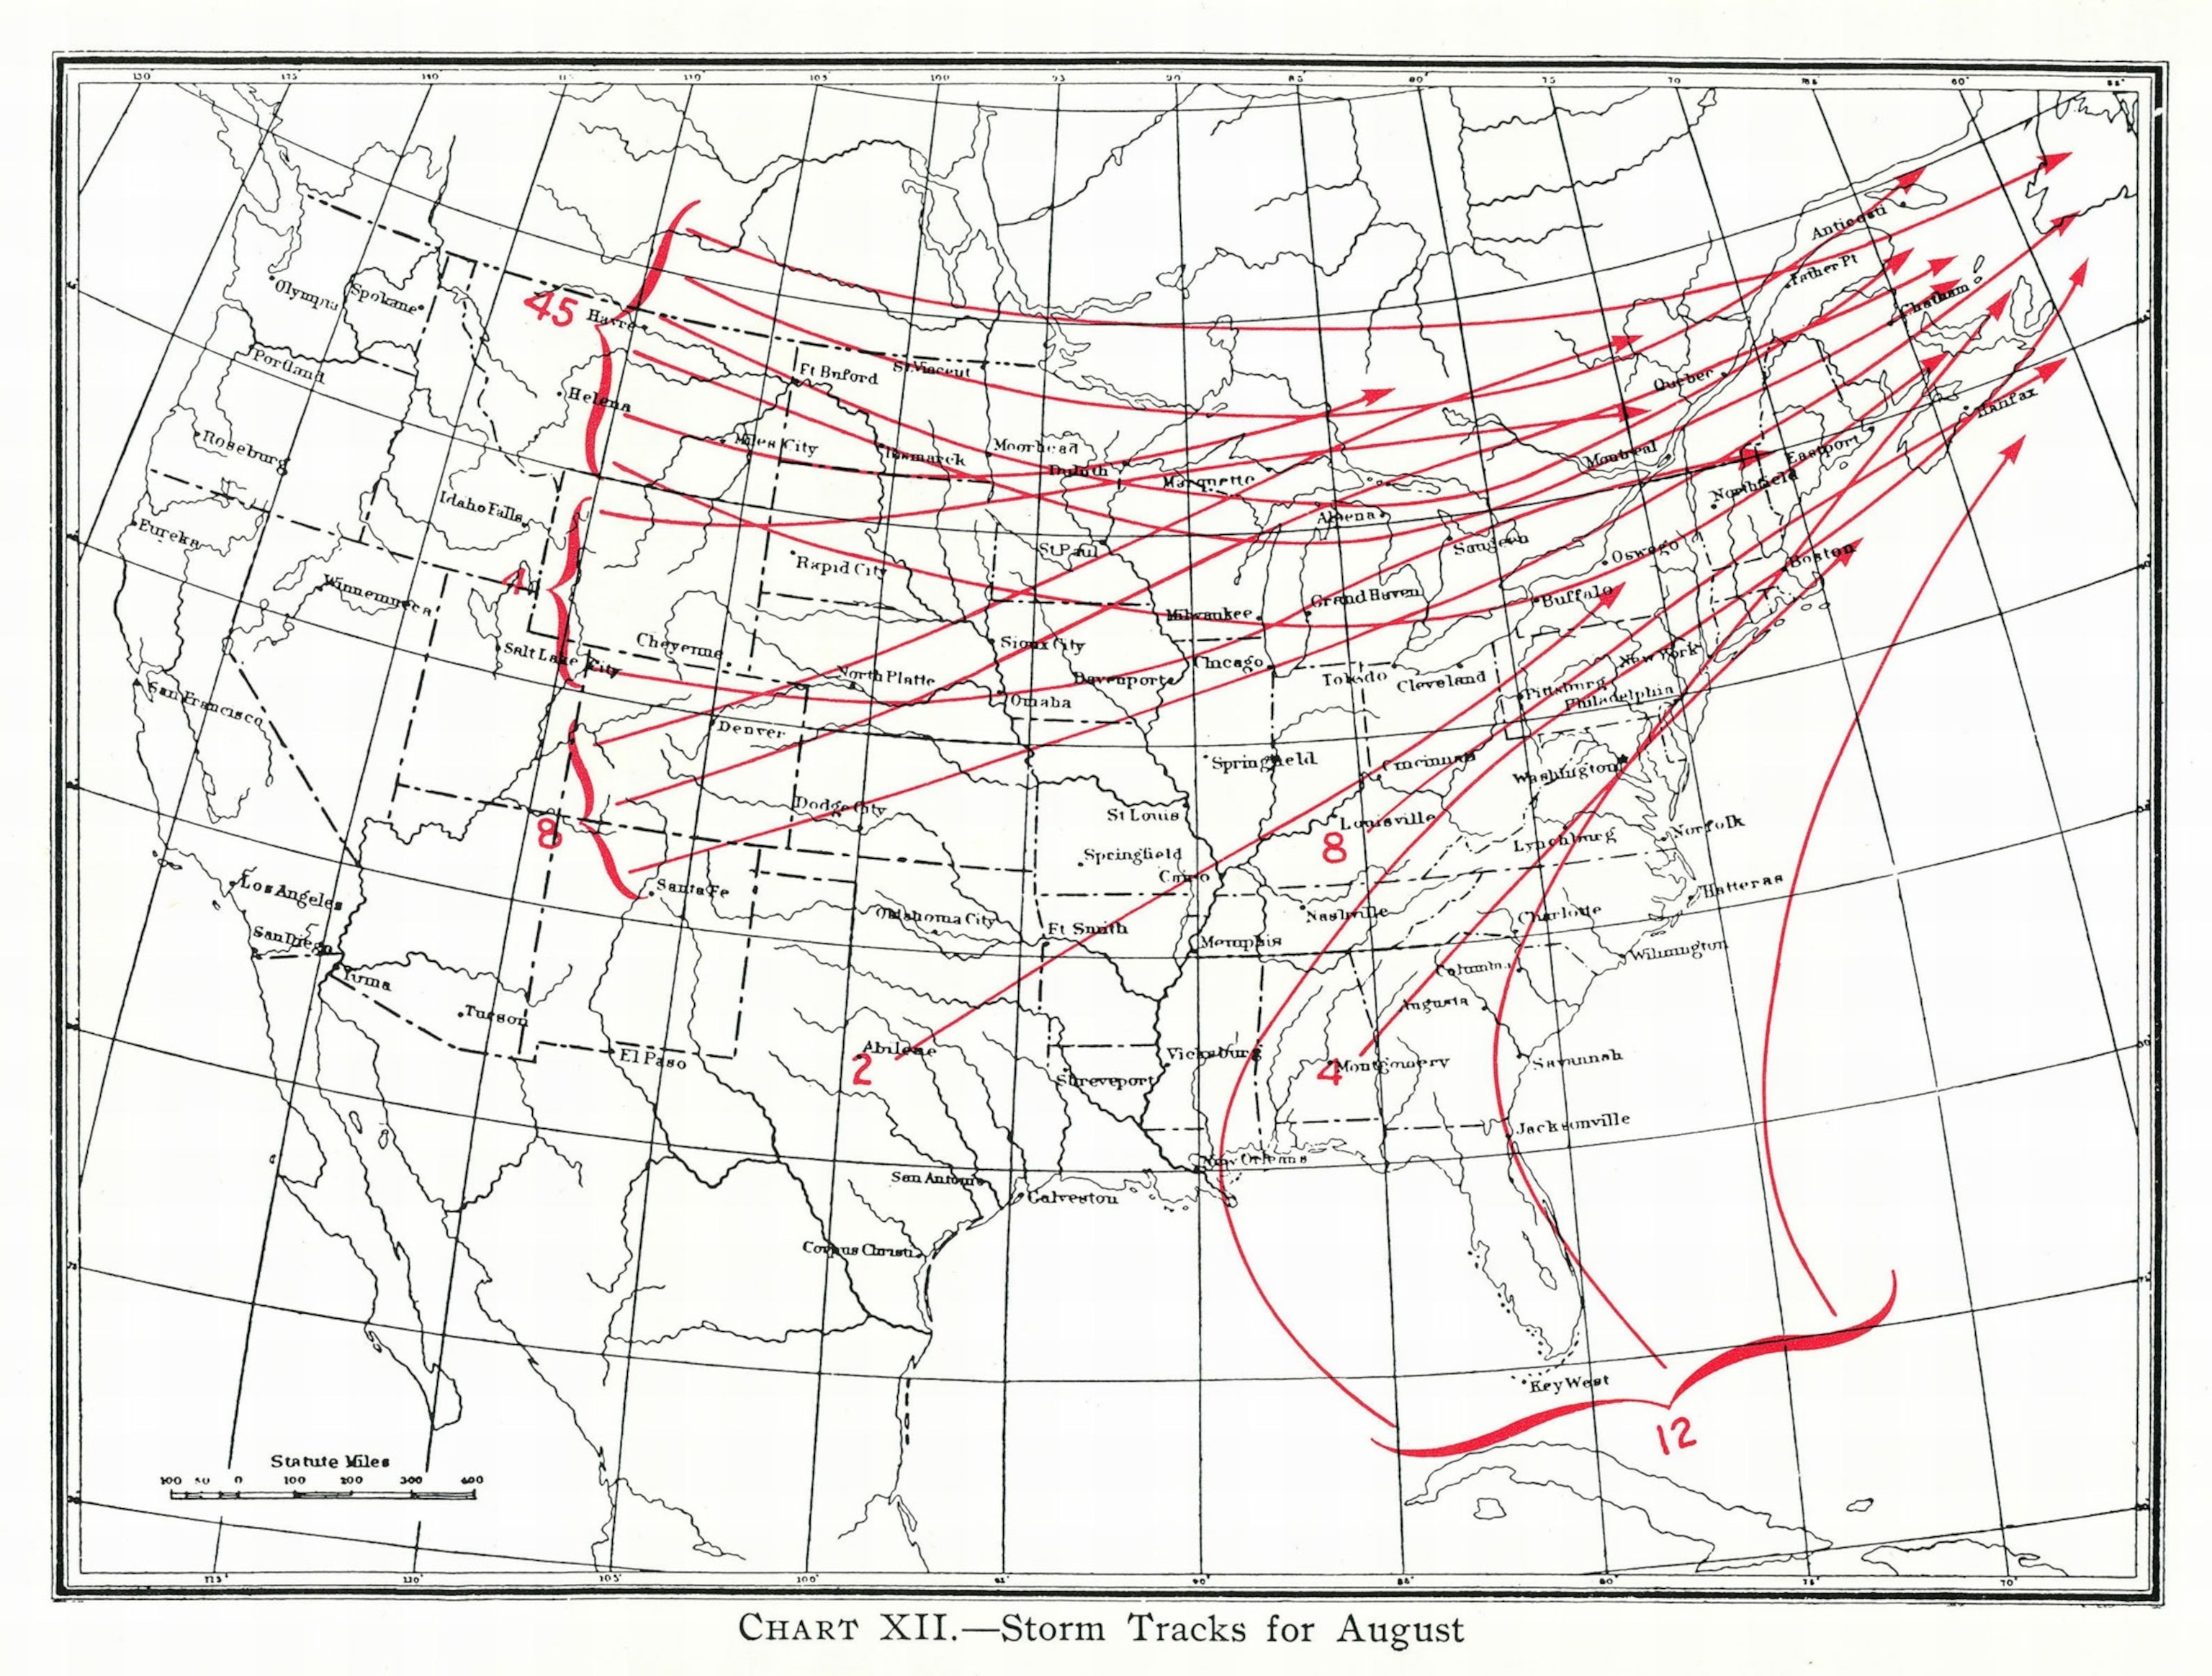
Two years later, Hayden wrote “The Law of Storms,” a magazine story that sought to educate sailors and ship captains on the science of ocean hurricanes. He included National Geographic’s first published hurricane map: a sketch of the wind paths that had fomented into storms in the North Atlantic Ocean over the past two years. The lines curved inward, resembling fingerprints, and some fanned out at a wide angle. These rudimentary swirls were drawn, Hayden wrote, from “actual observation.”
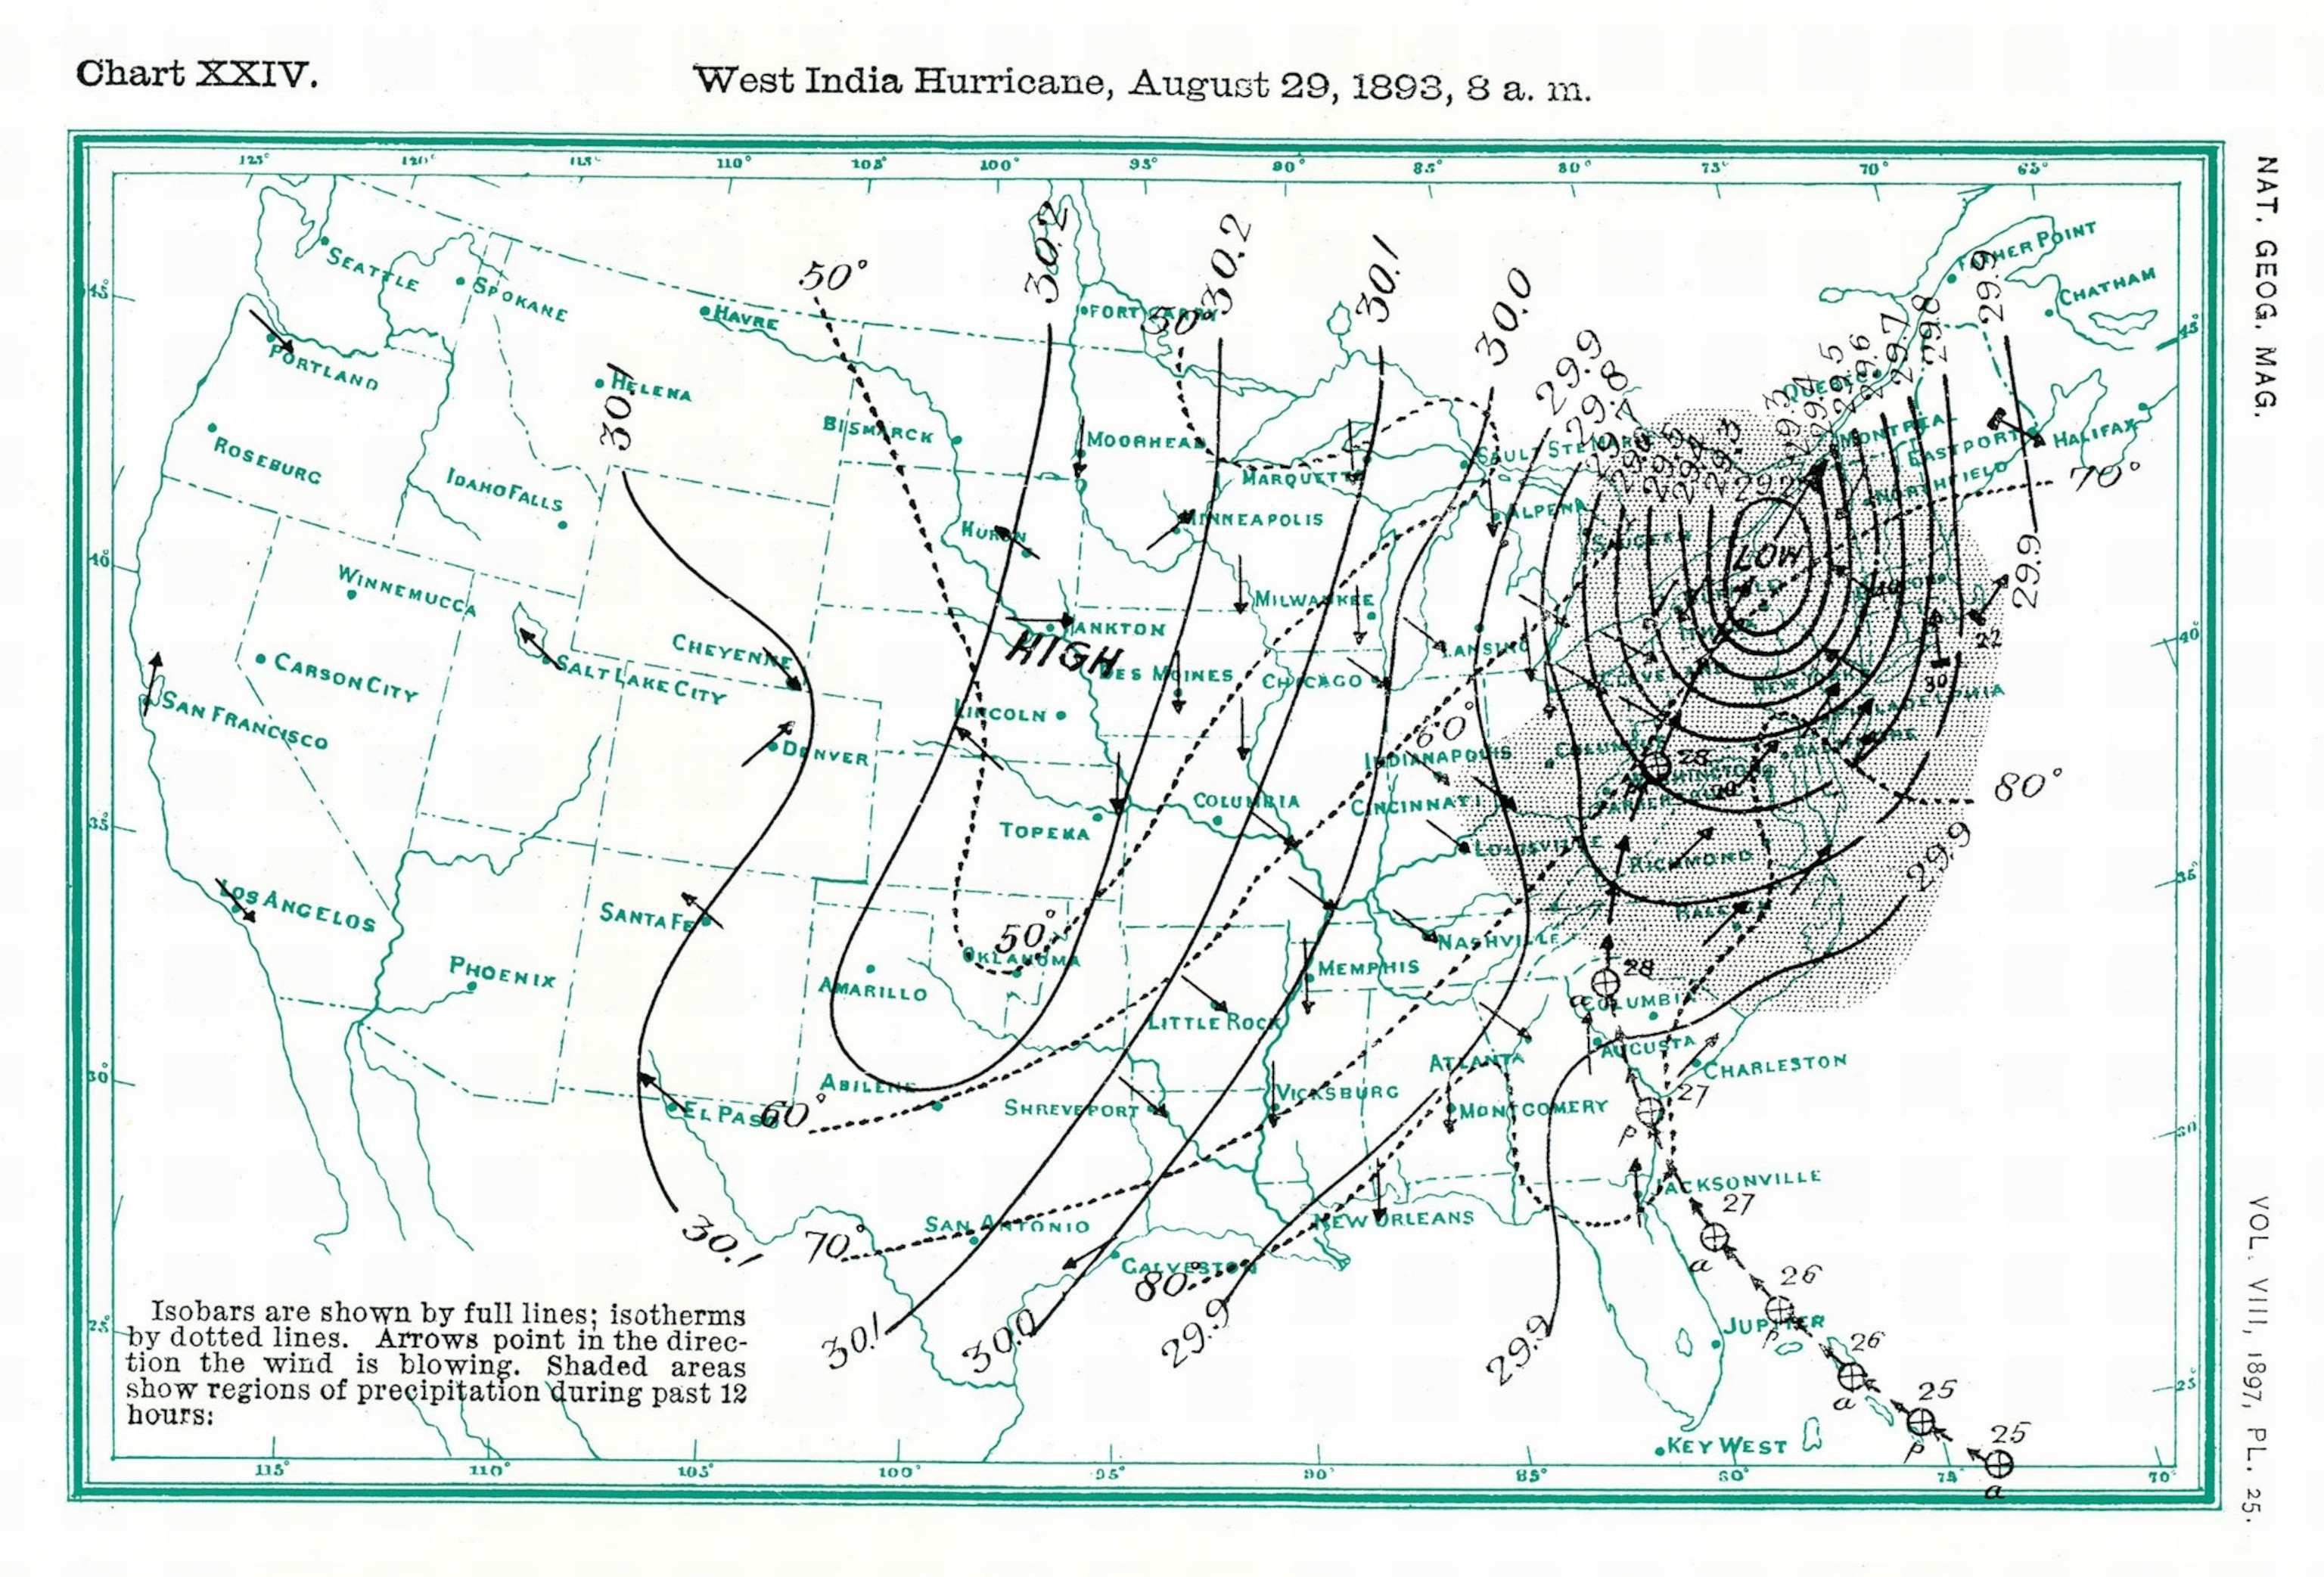
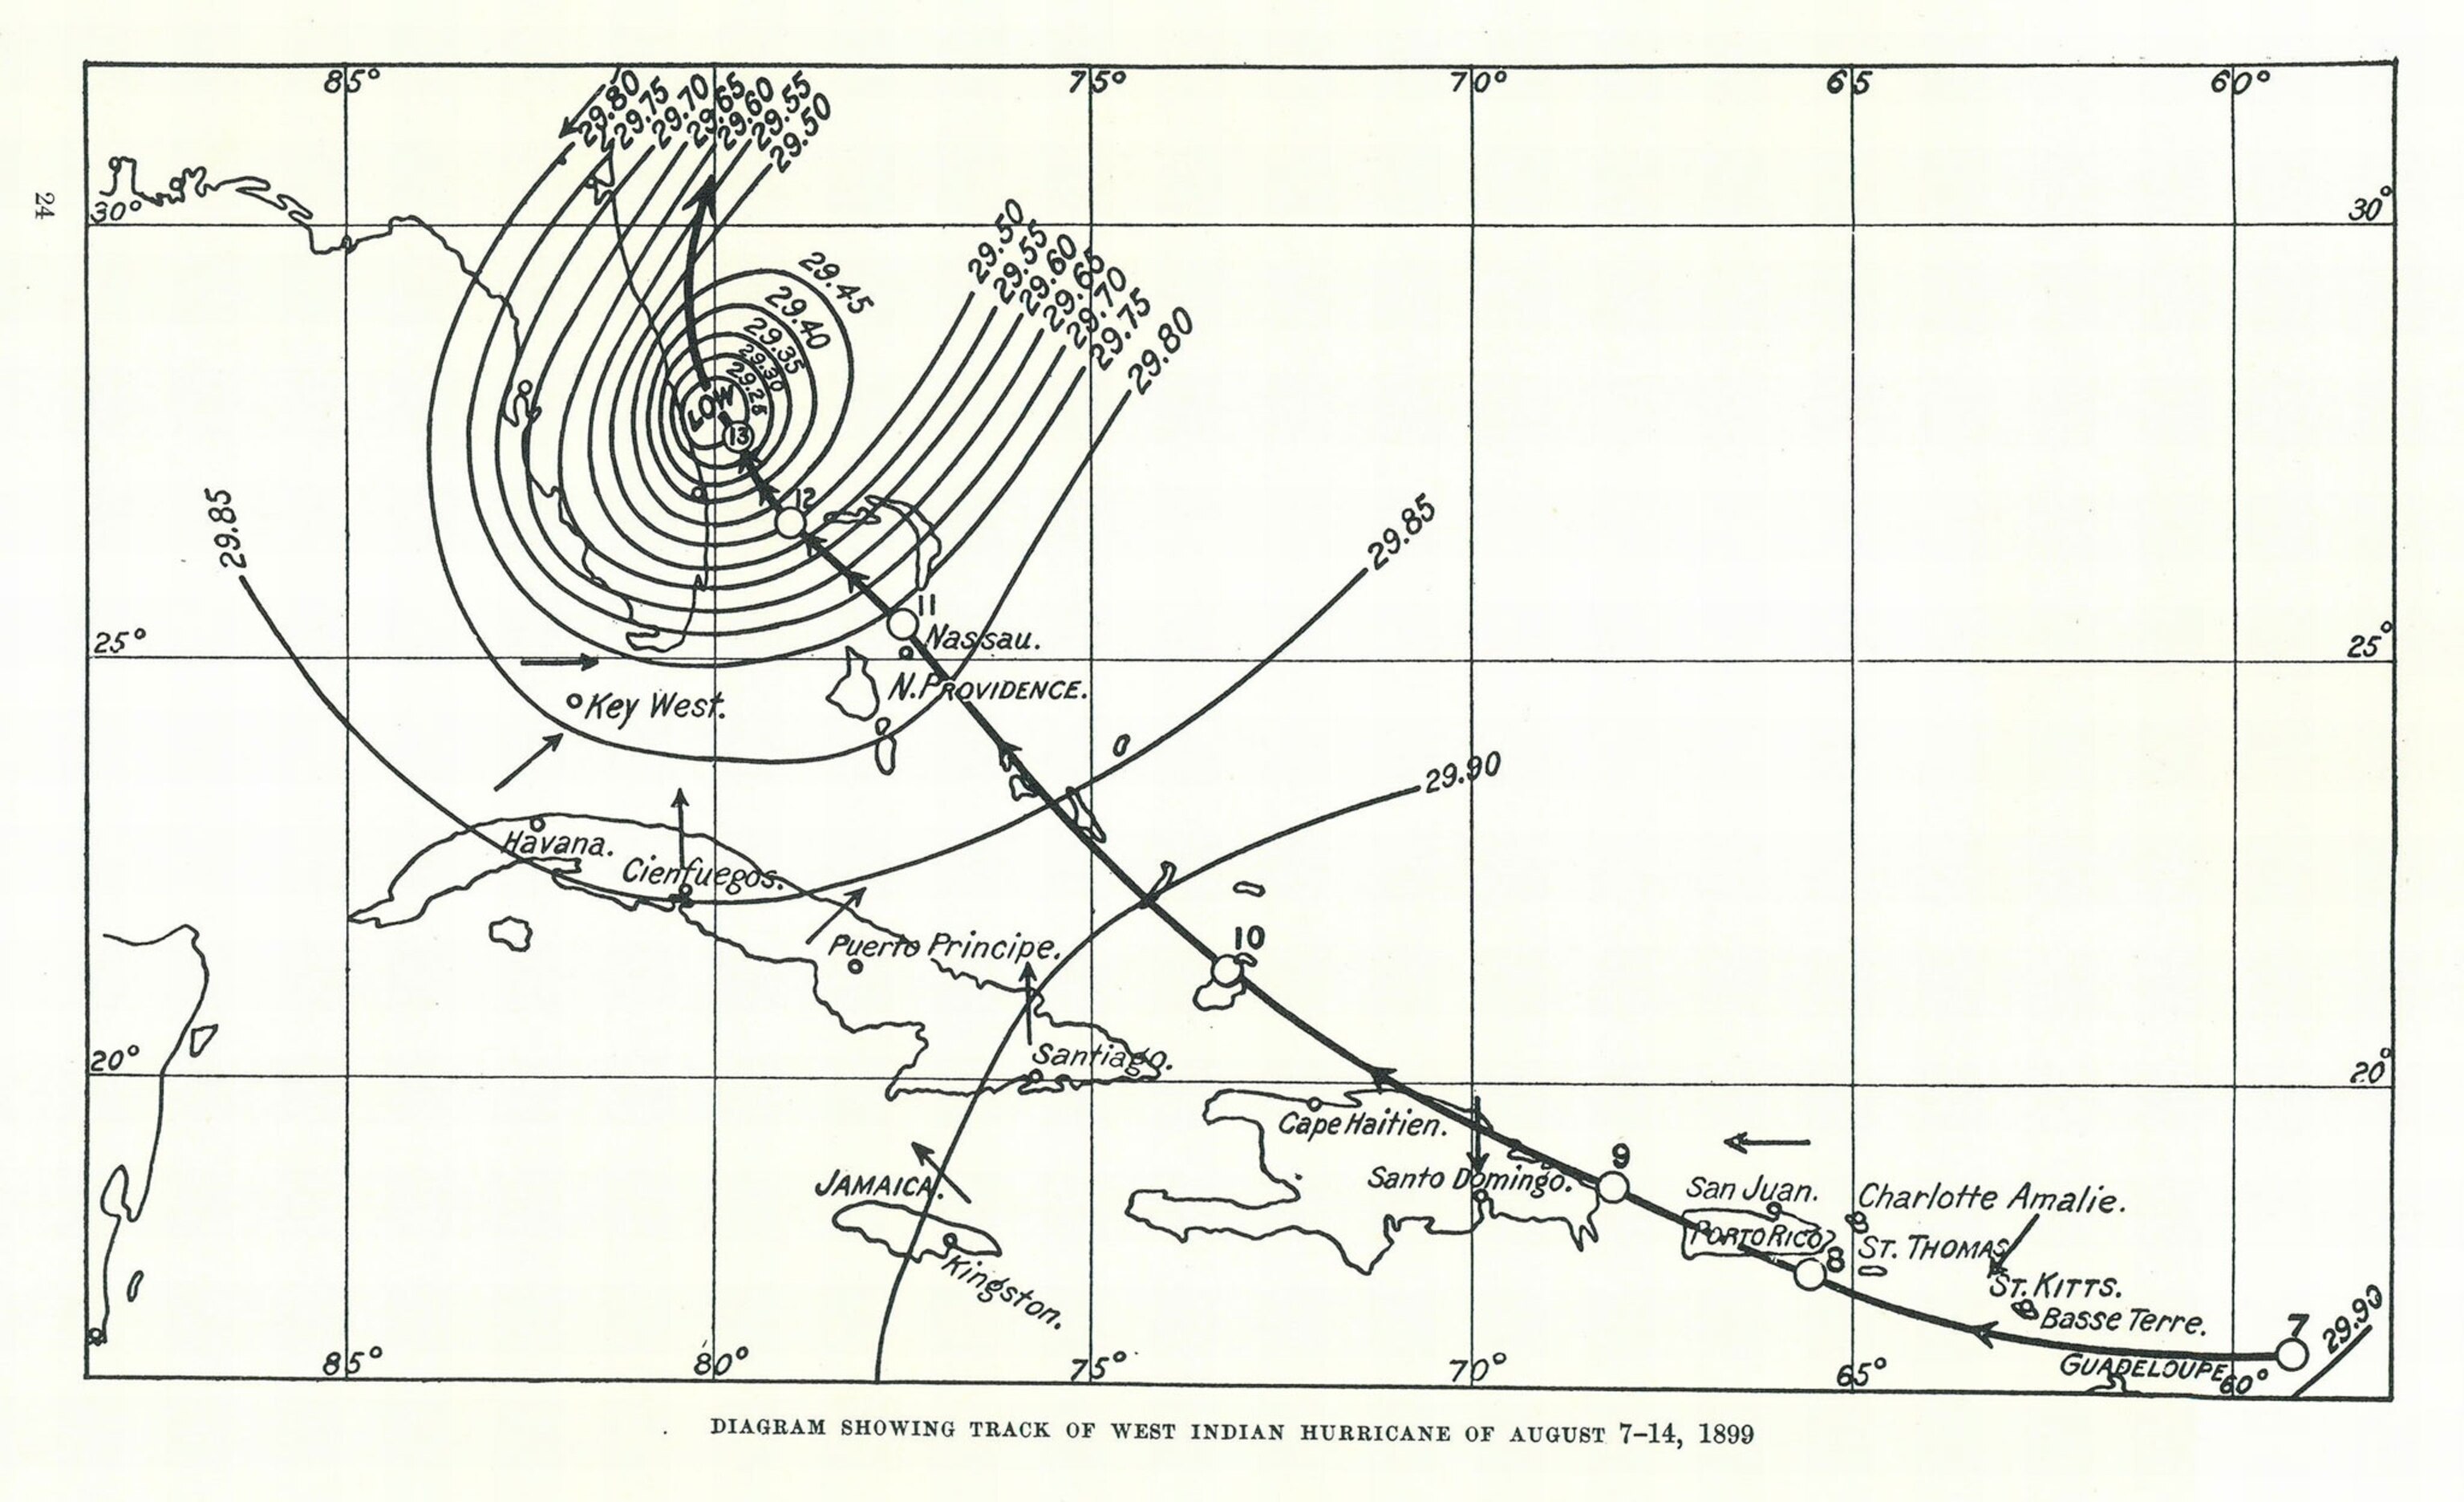
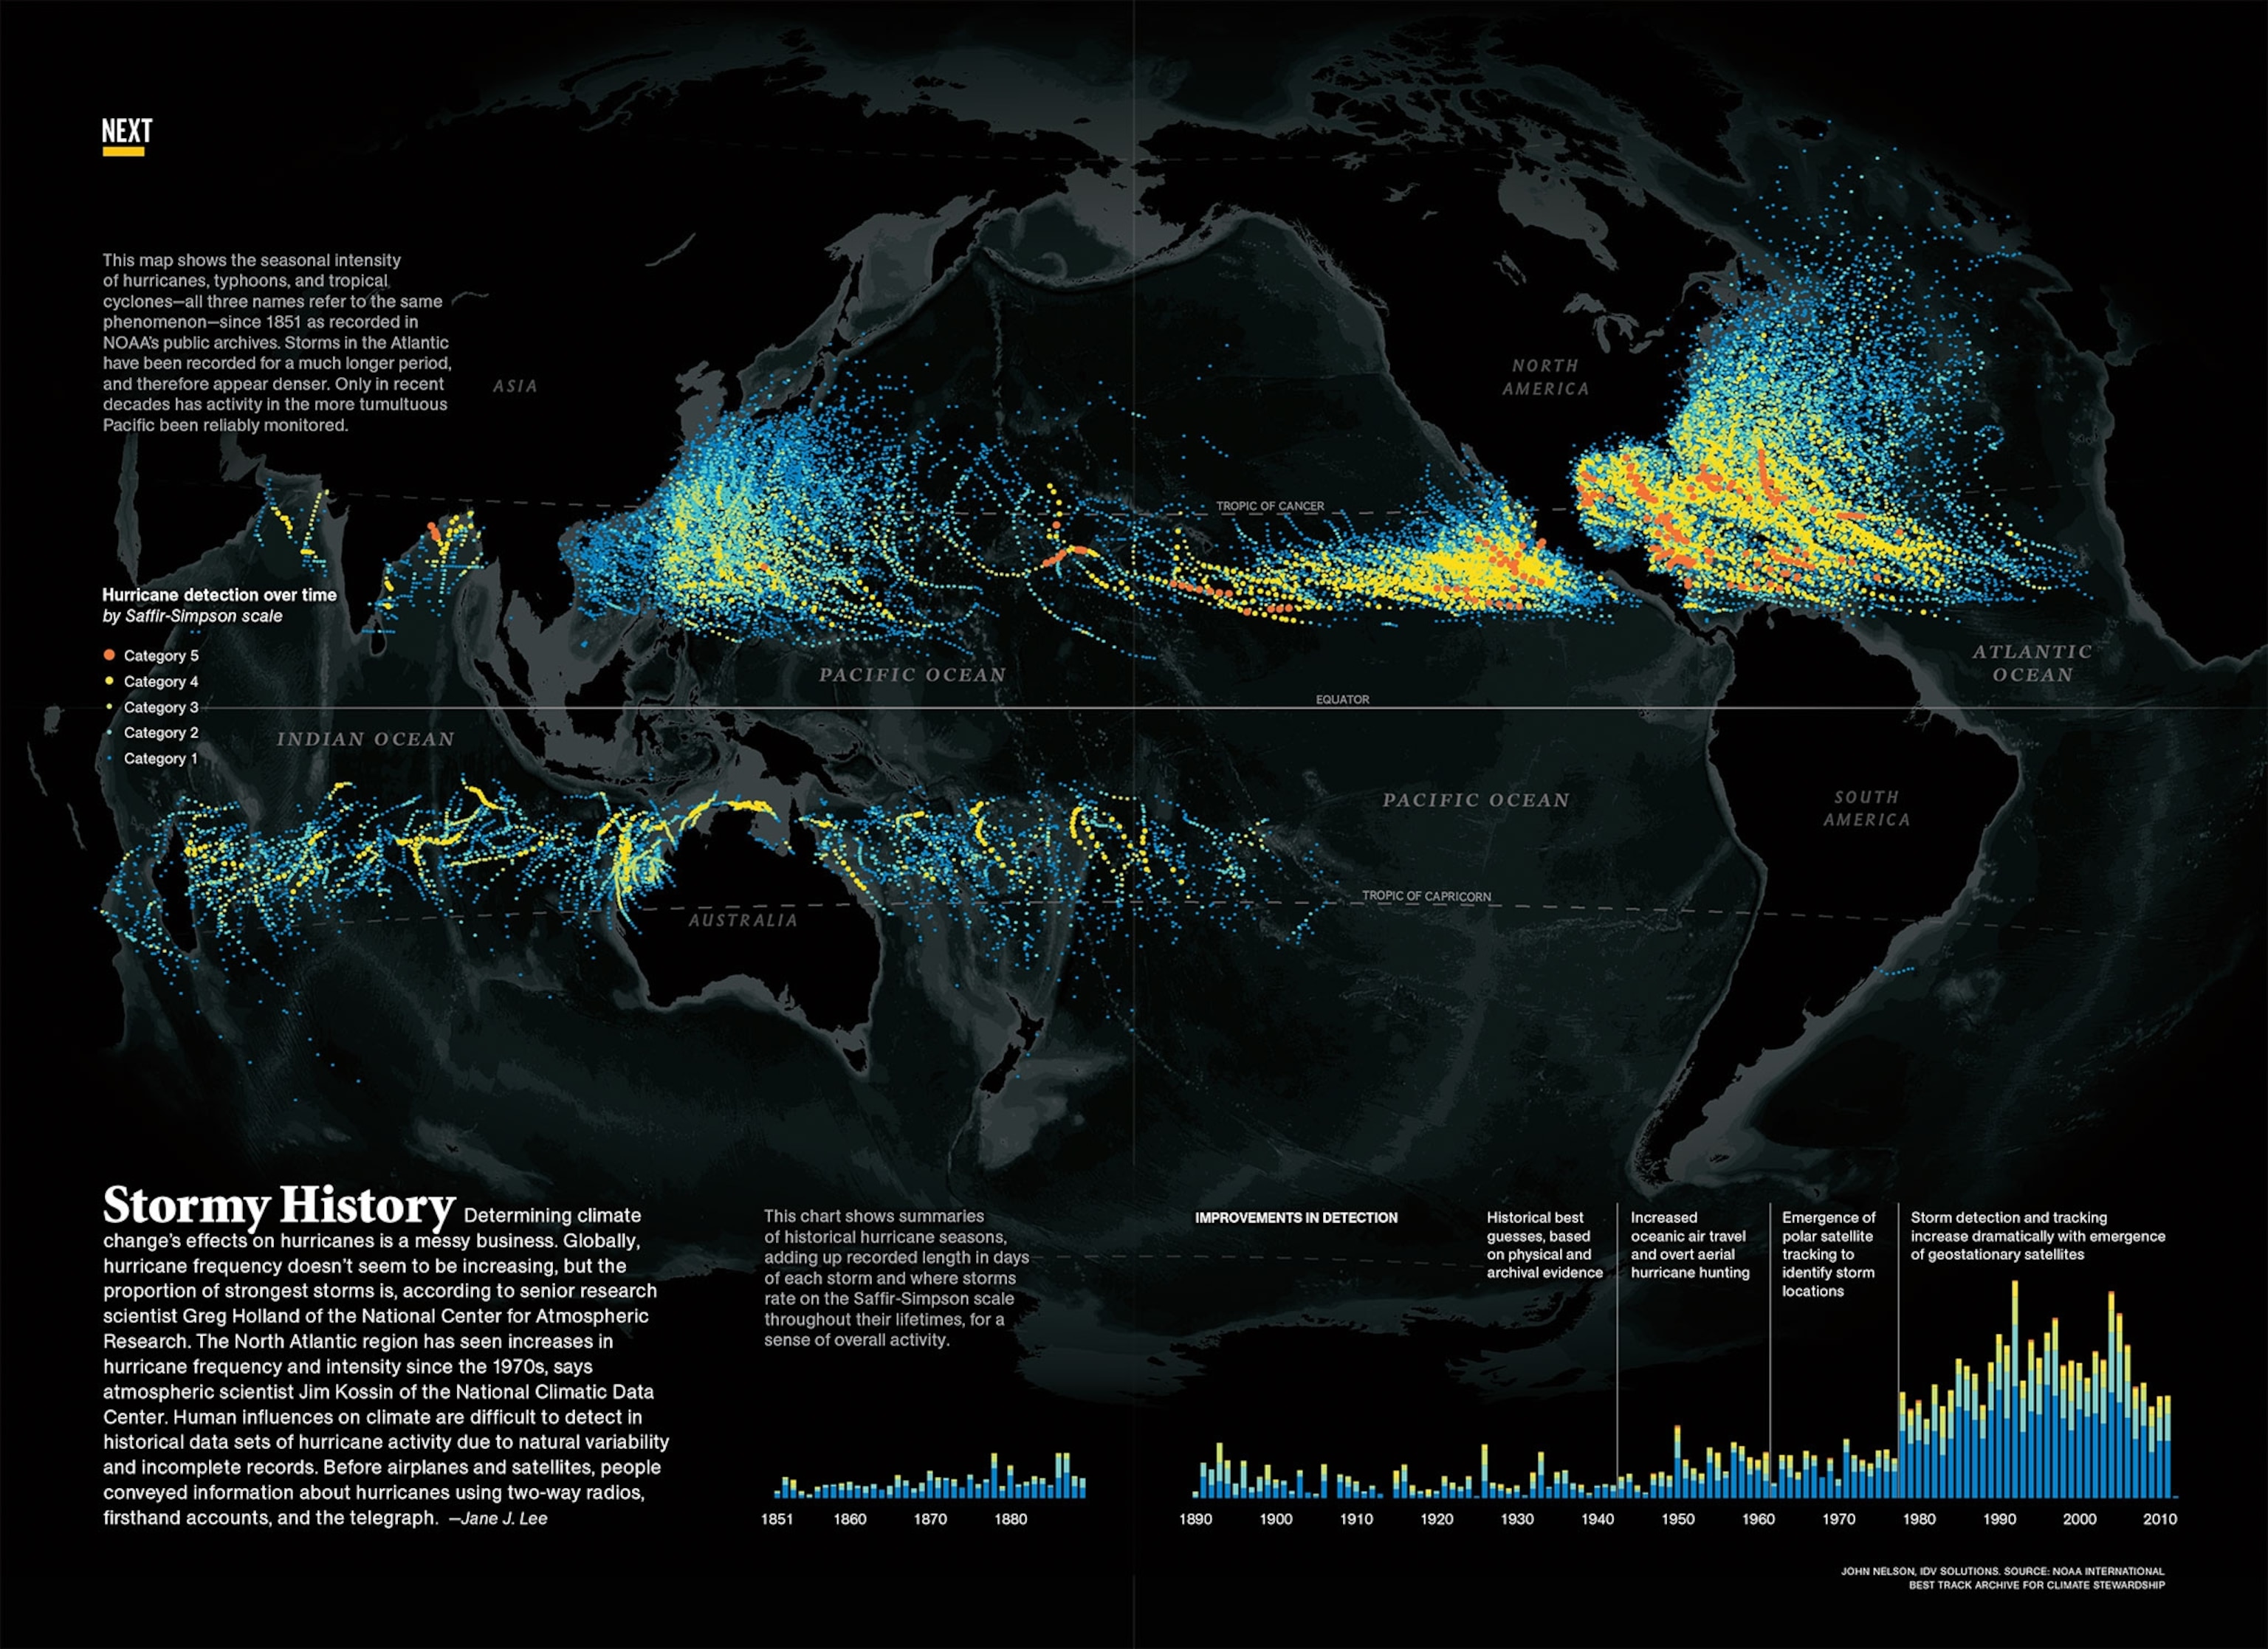
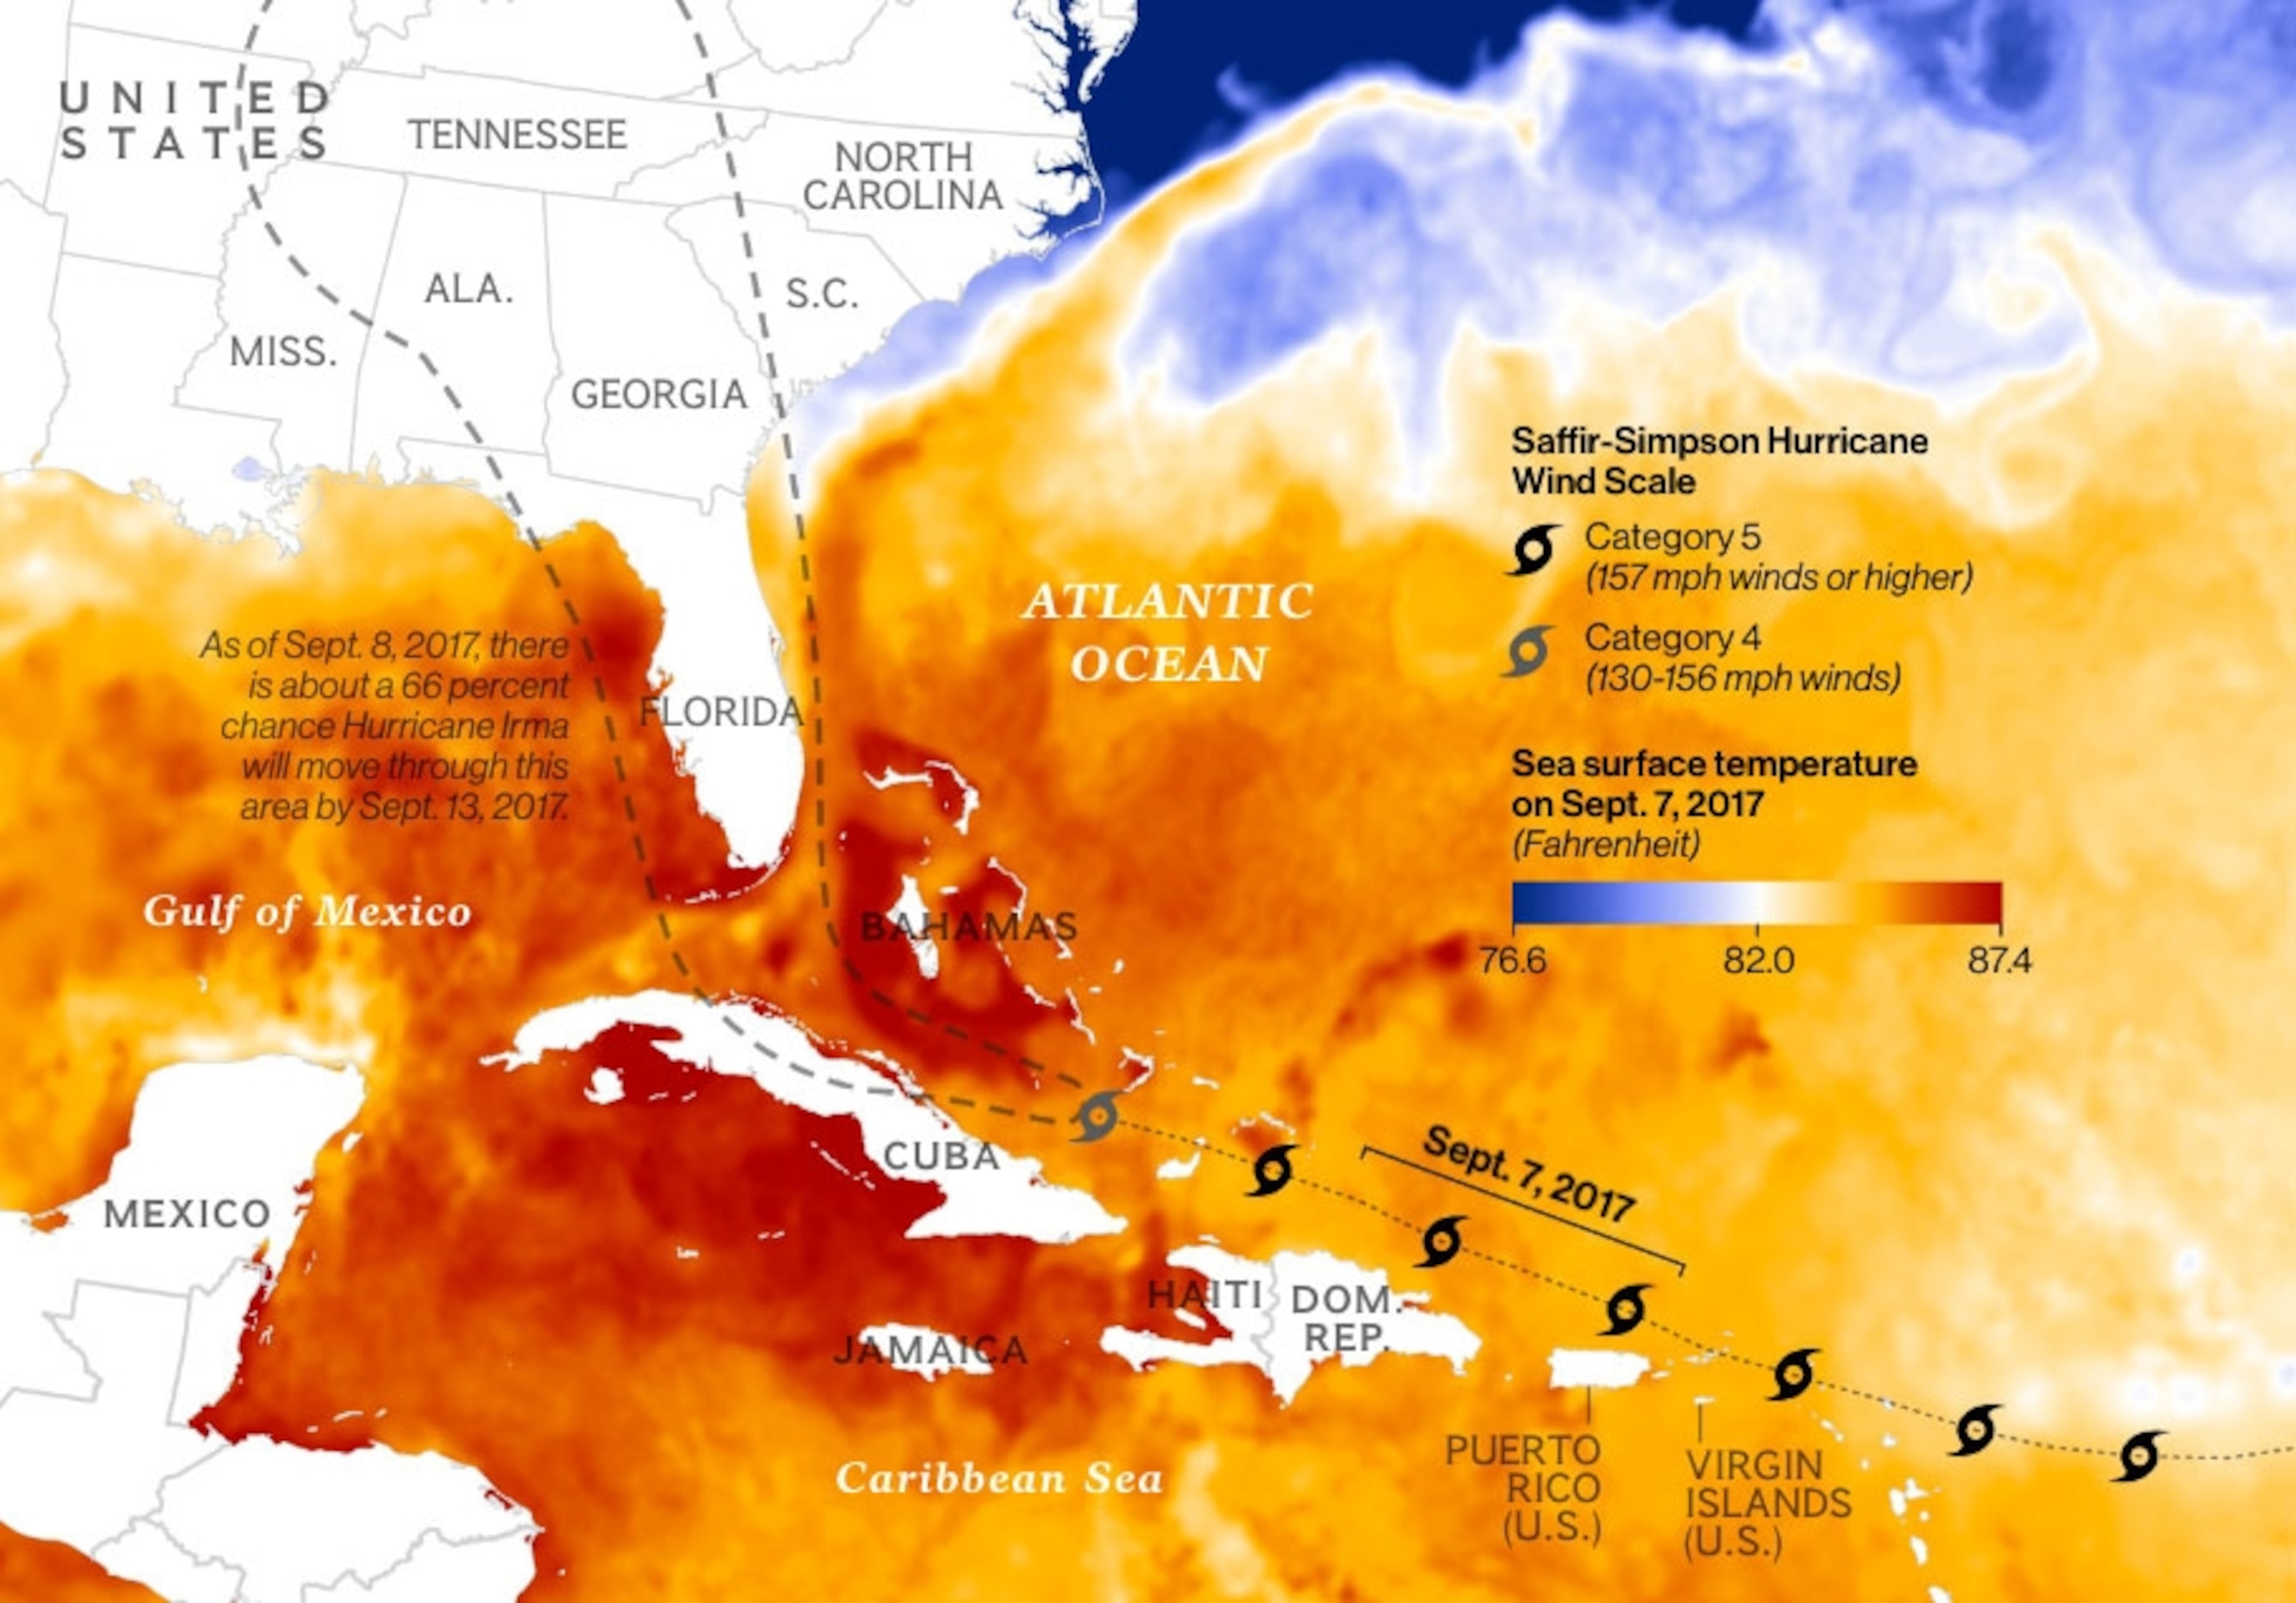
Storm mapping has become infinitely more sophisticated and reliable. While early maps were distilled from eyewitnesses, now satellites transmit images that can be used by cartographers almost instantly. “Instead of a computer it was a guy with a barometer,” says National Geographic senior graphics editor Matt Chwastyk, of early tracking systems. “A captain might report a storm forming, but where it hit was a surprise.”
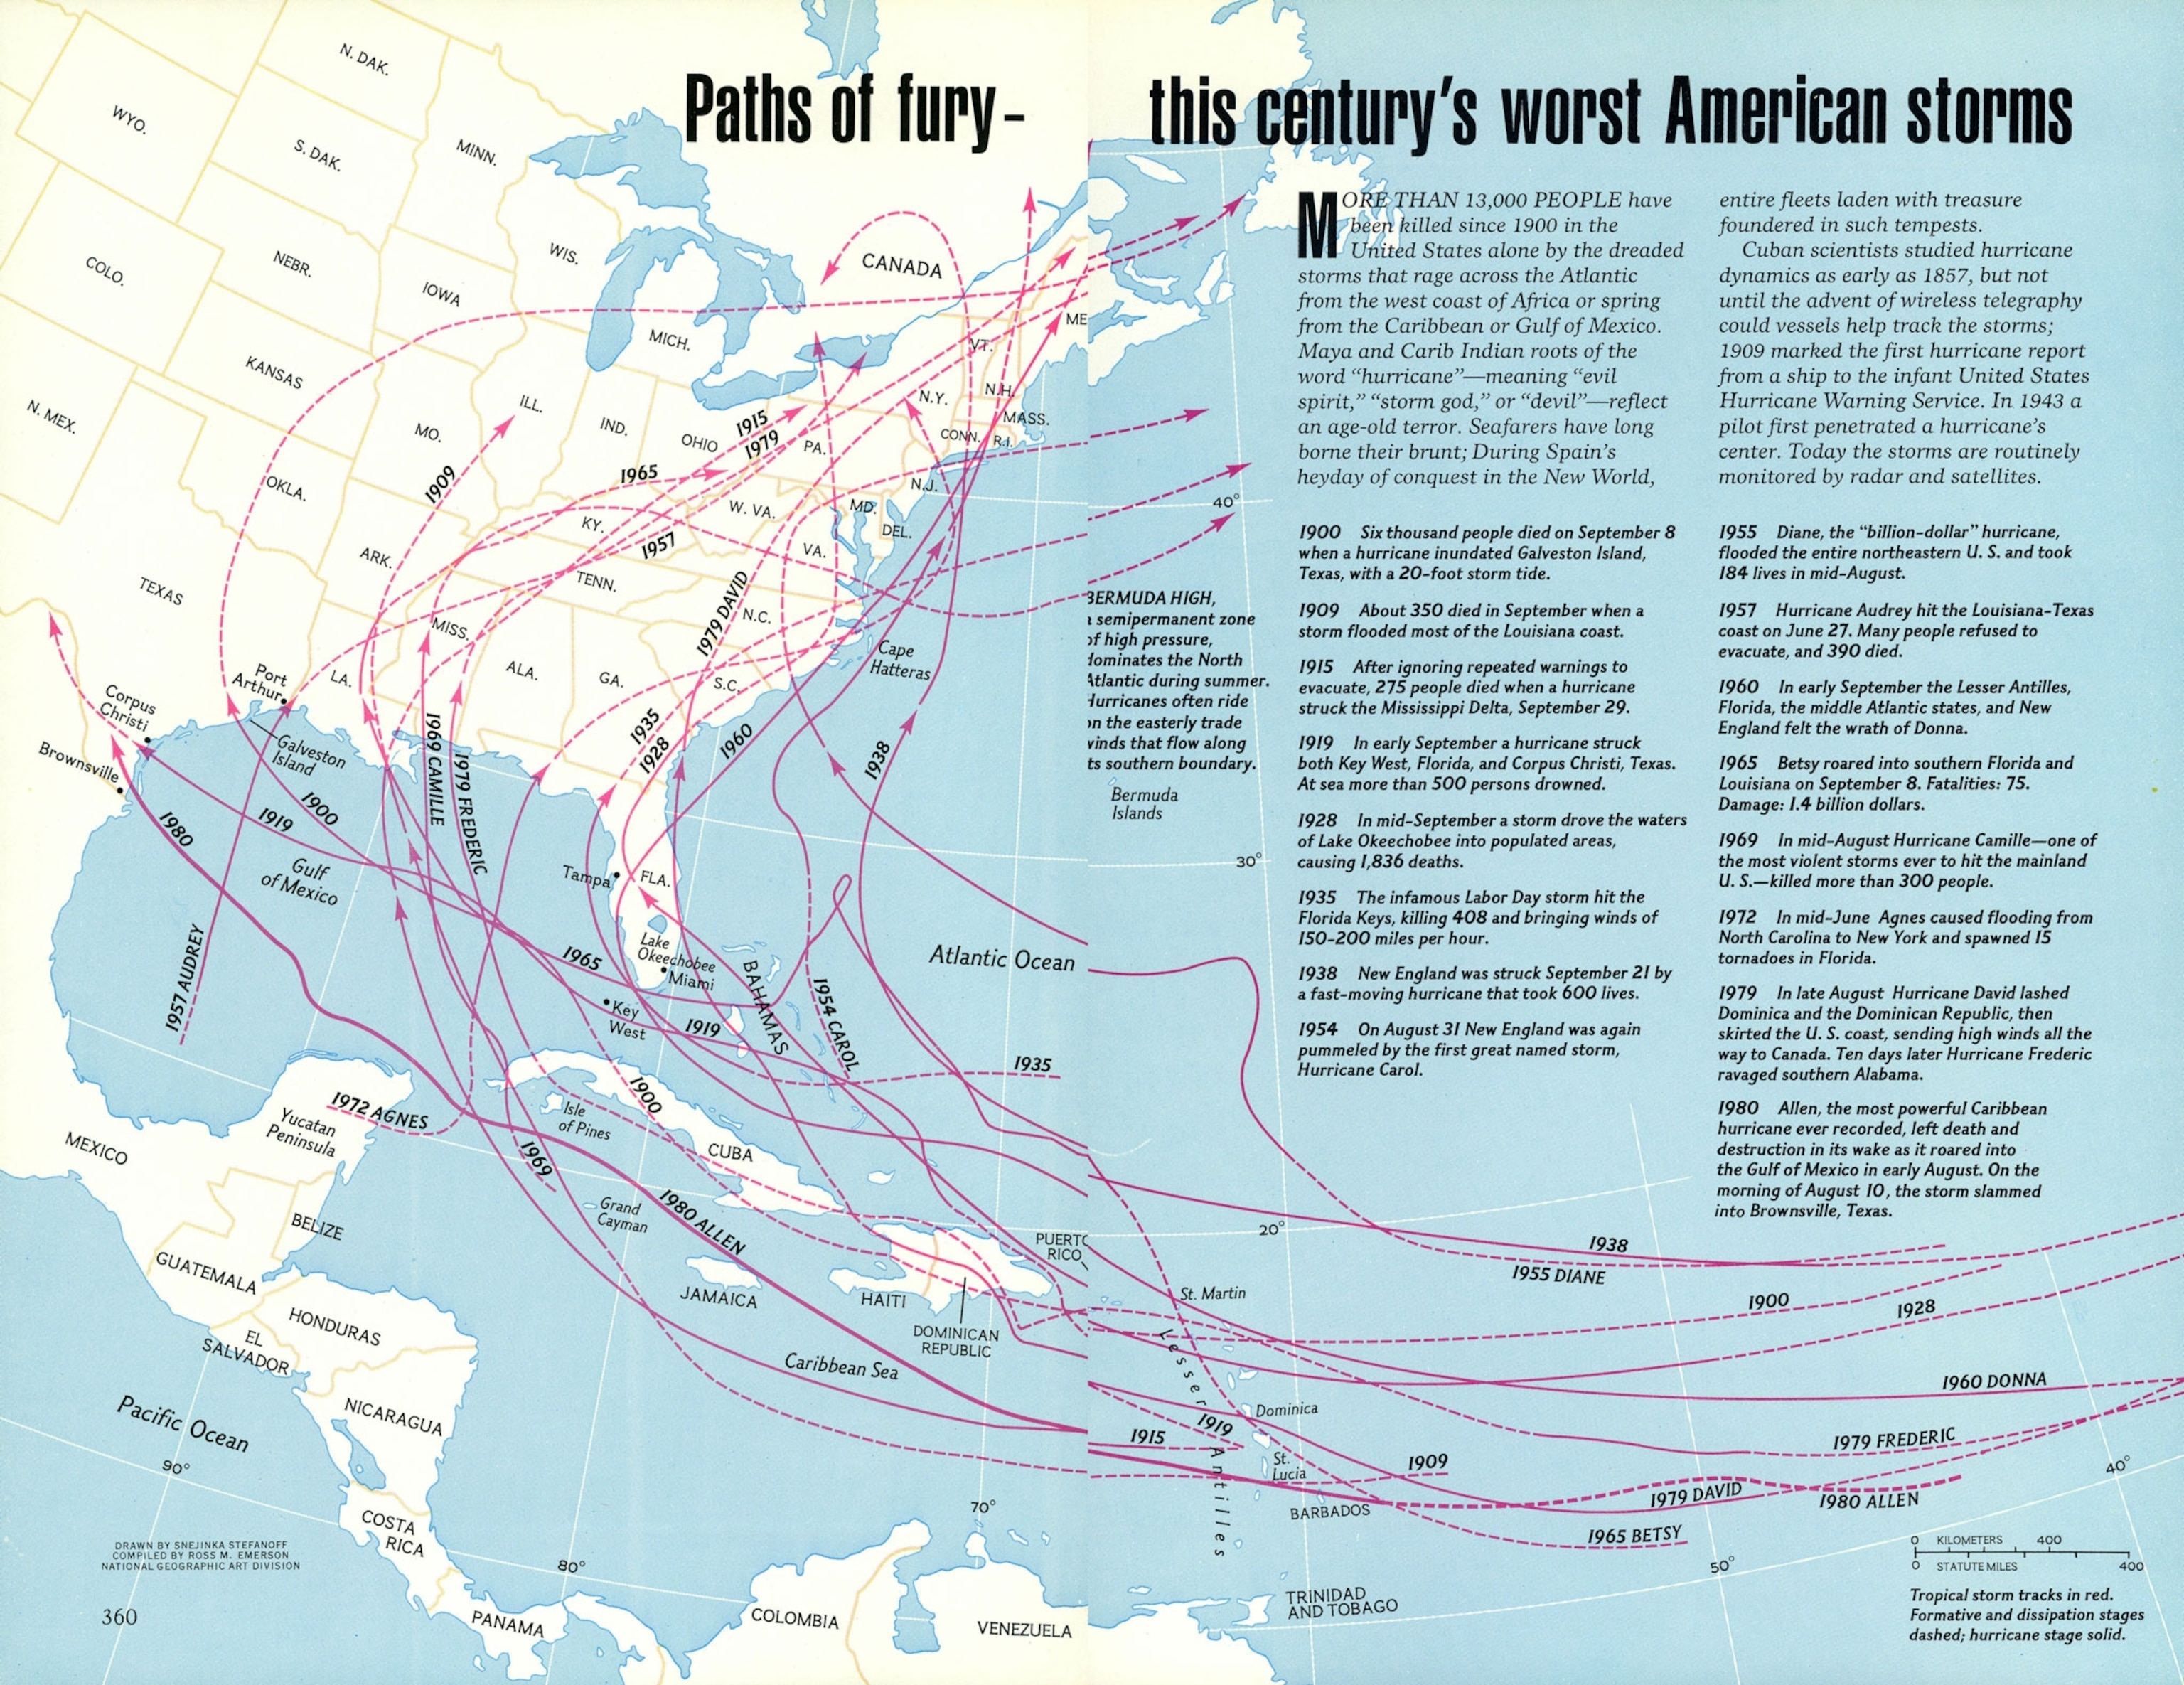
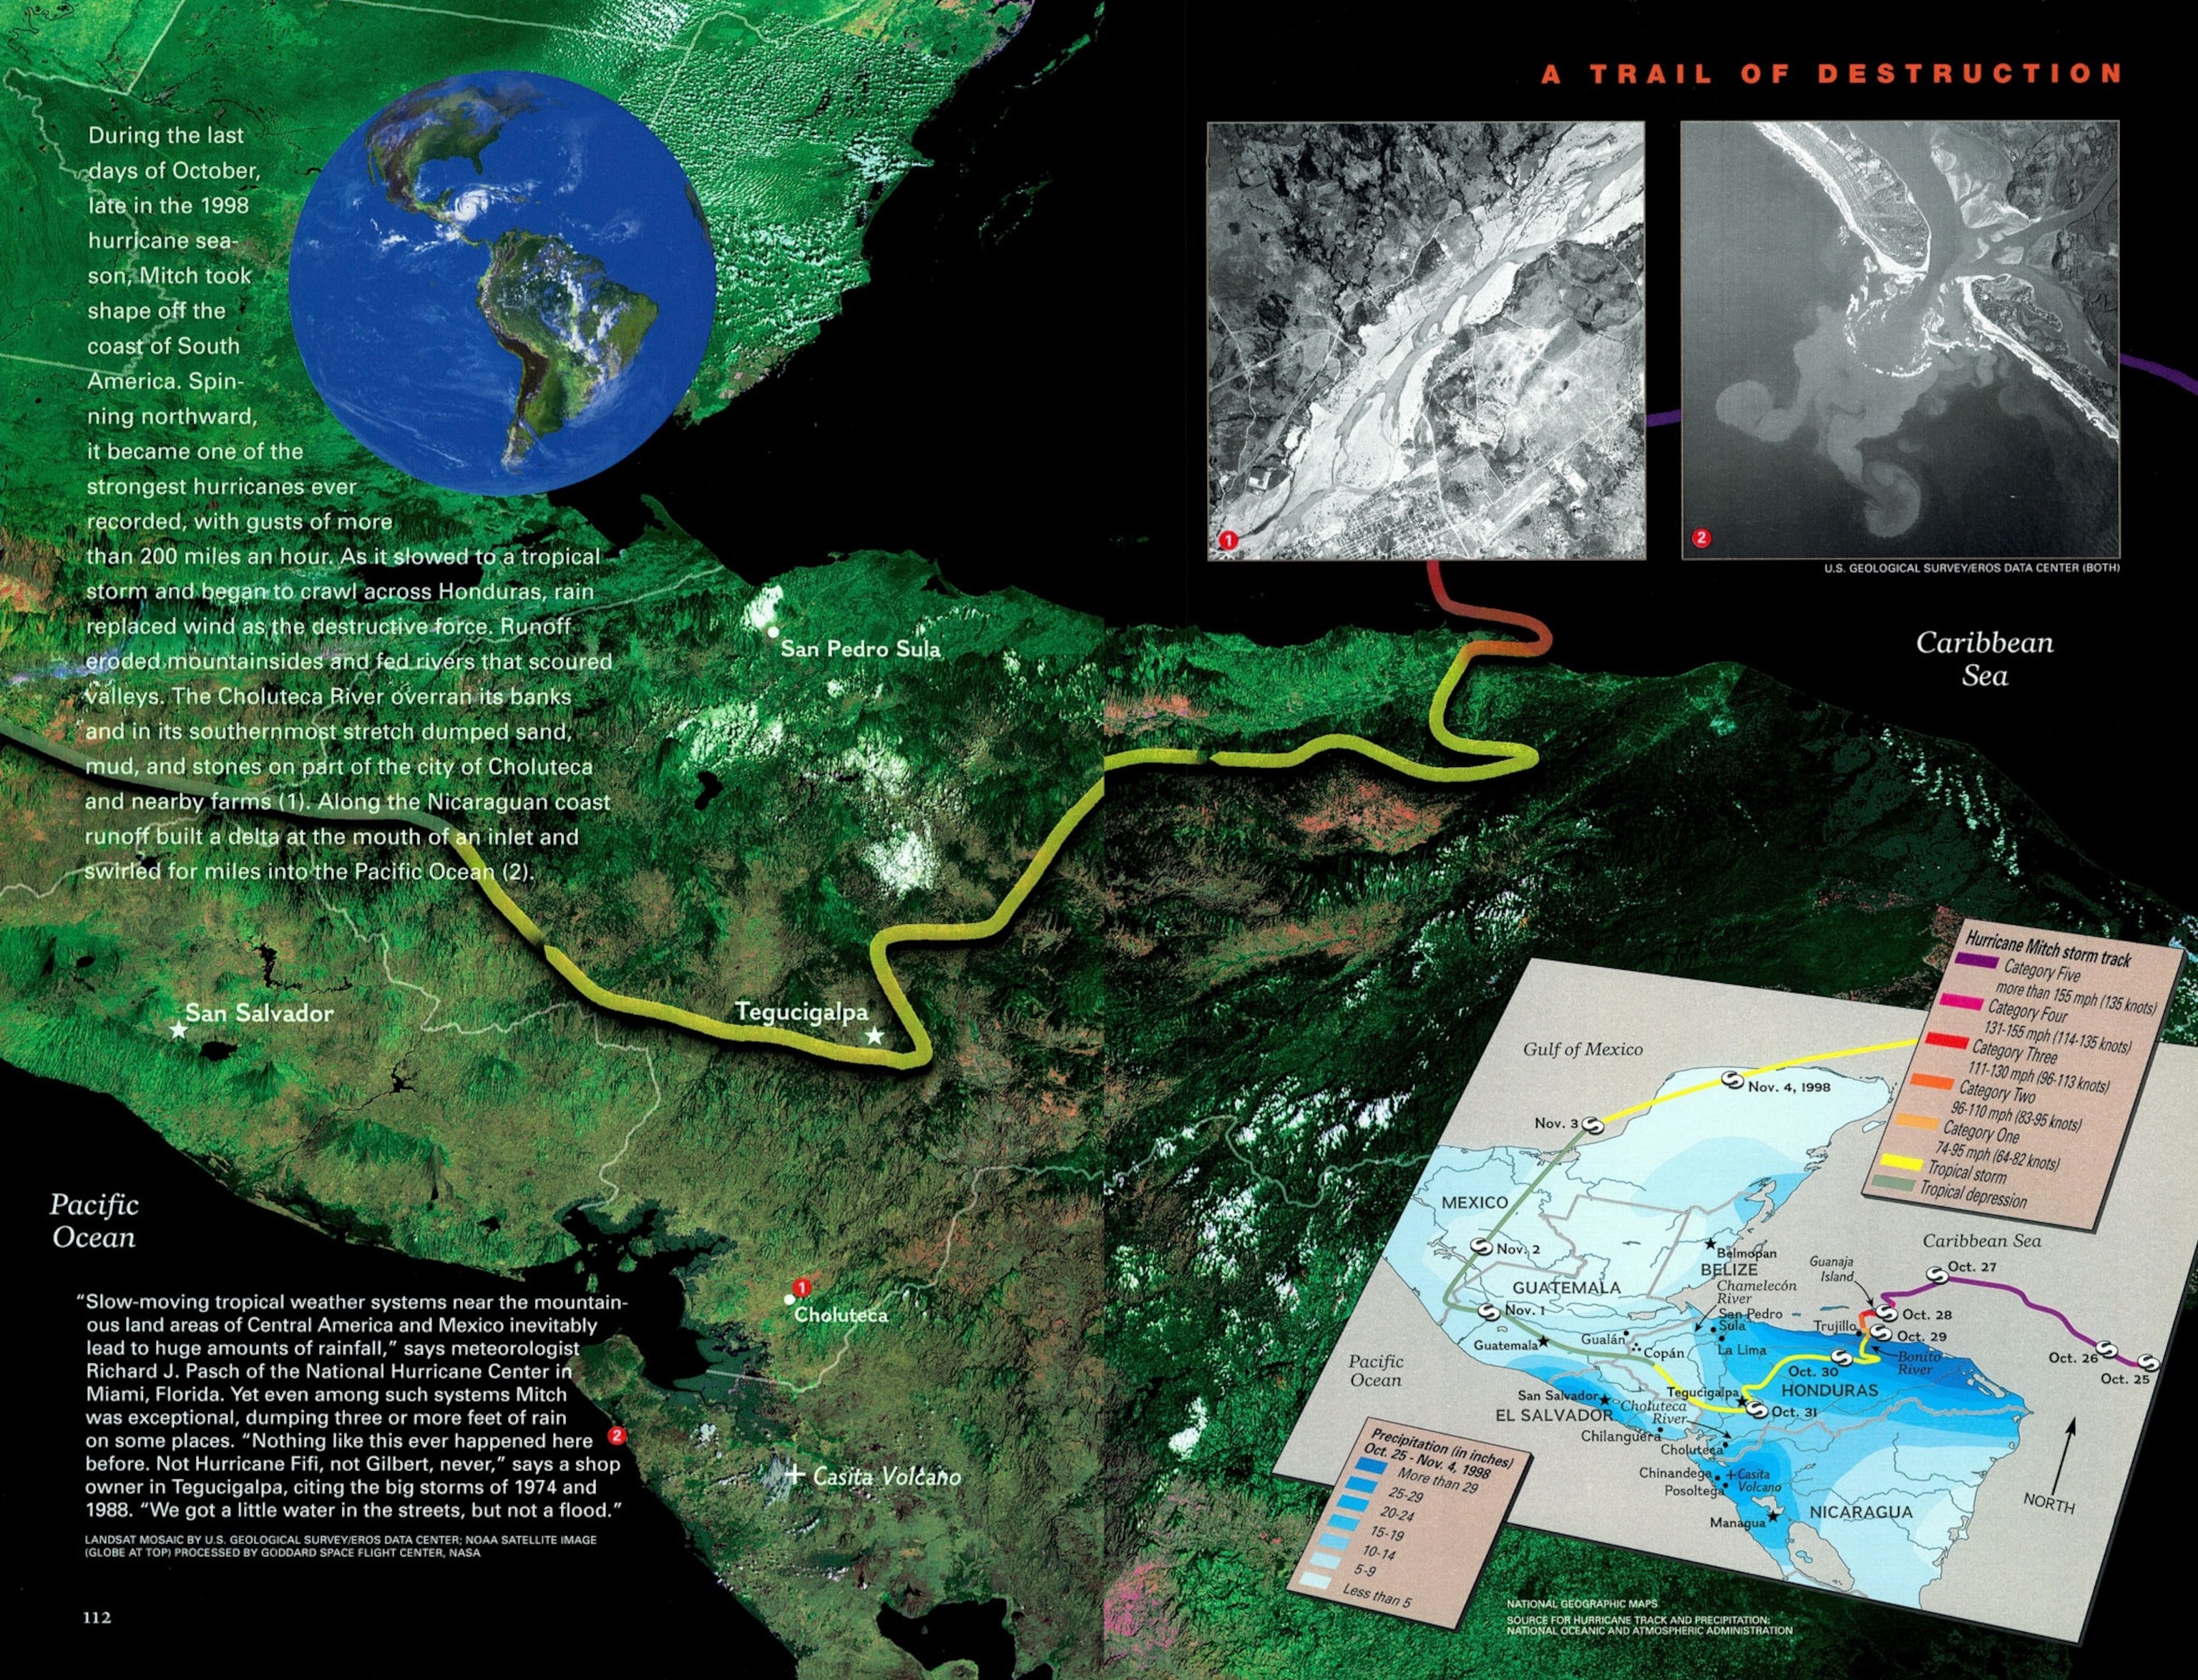
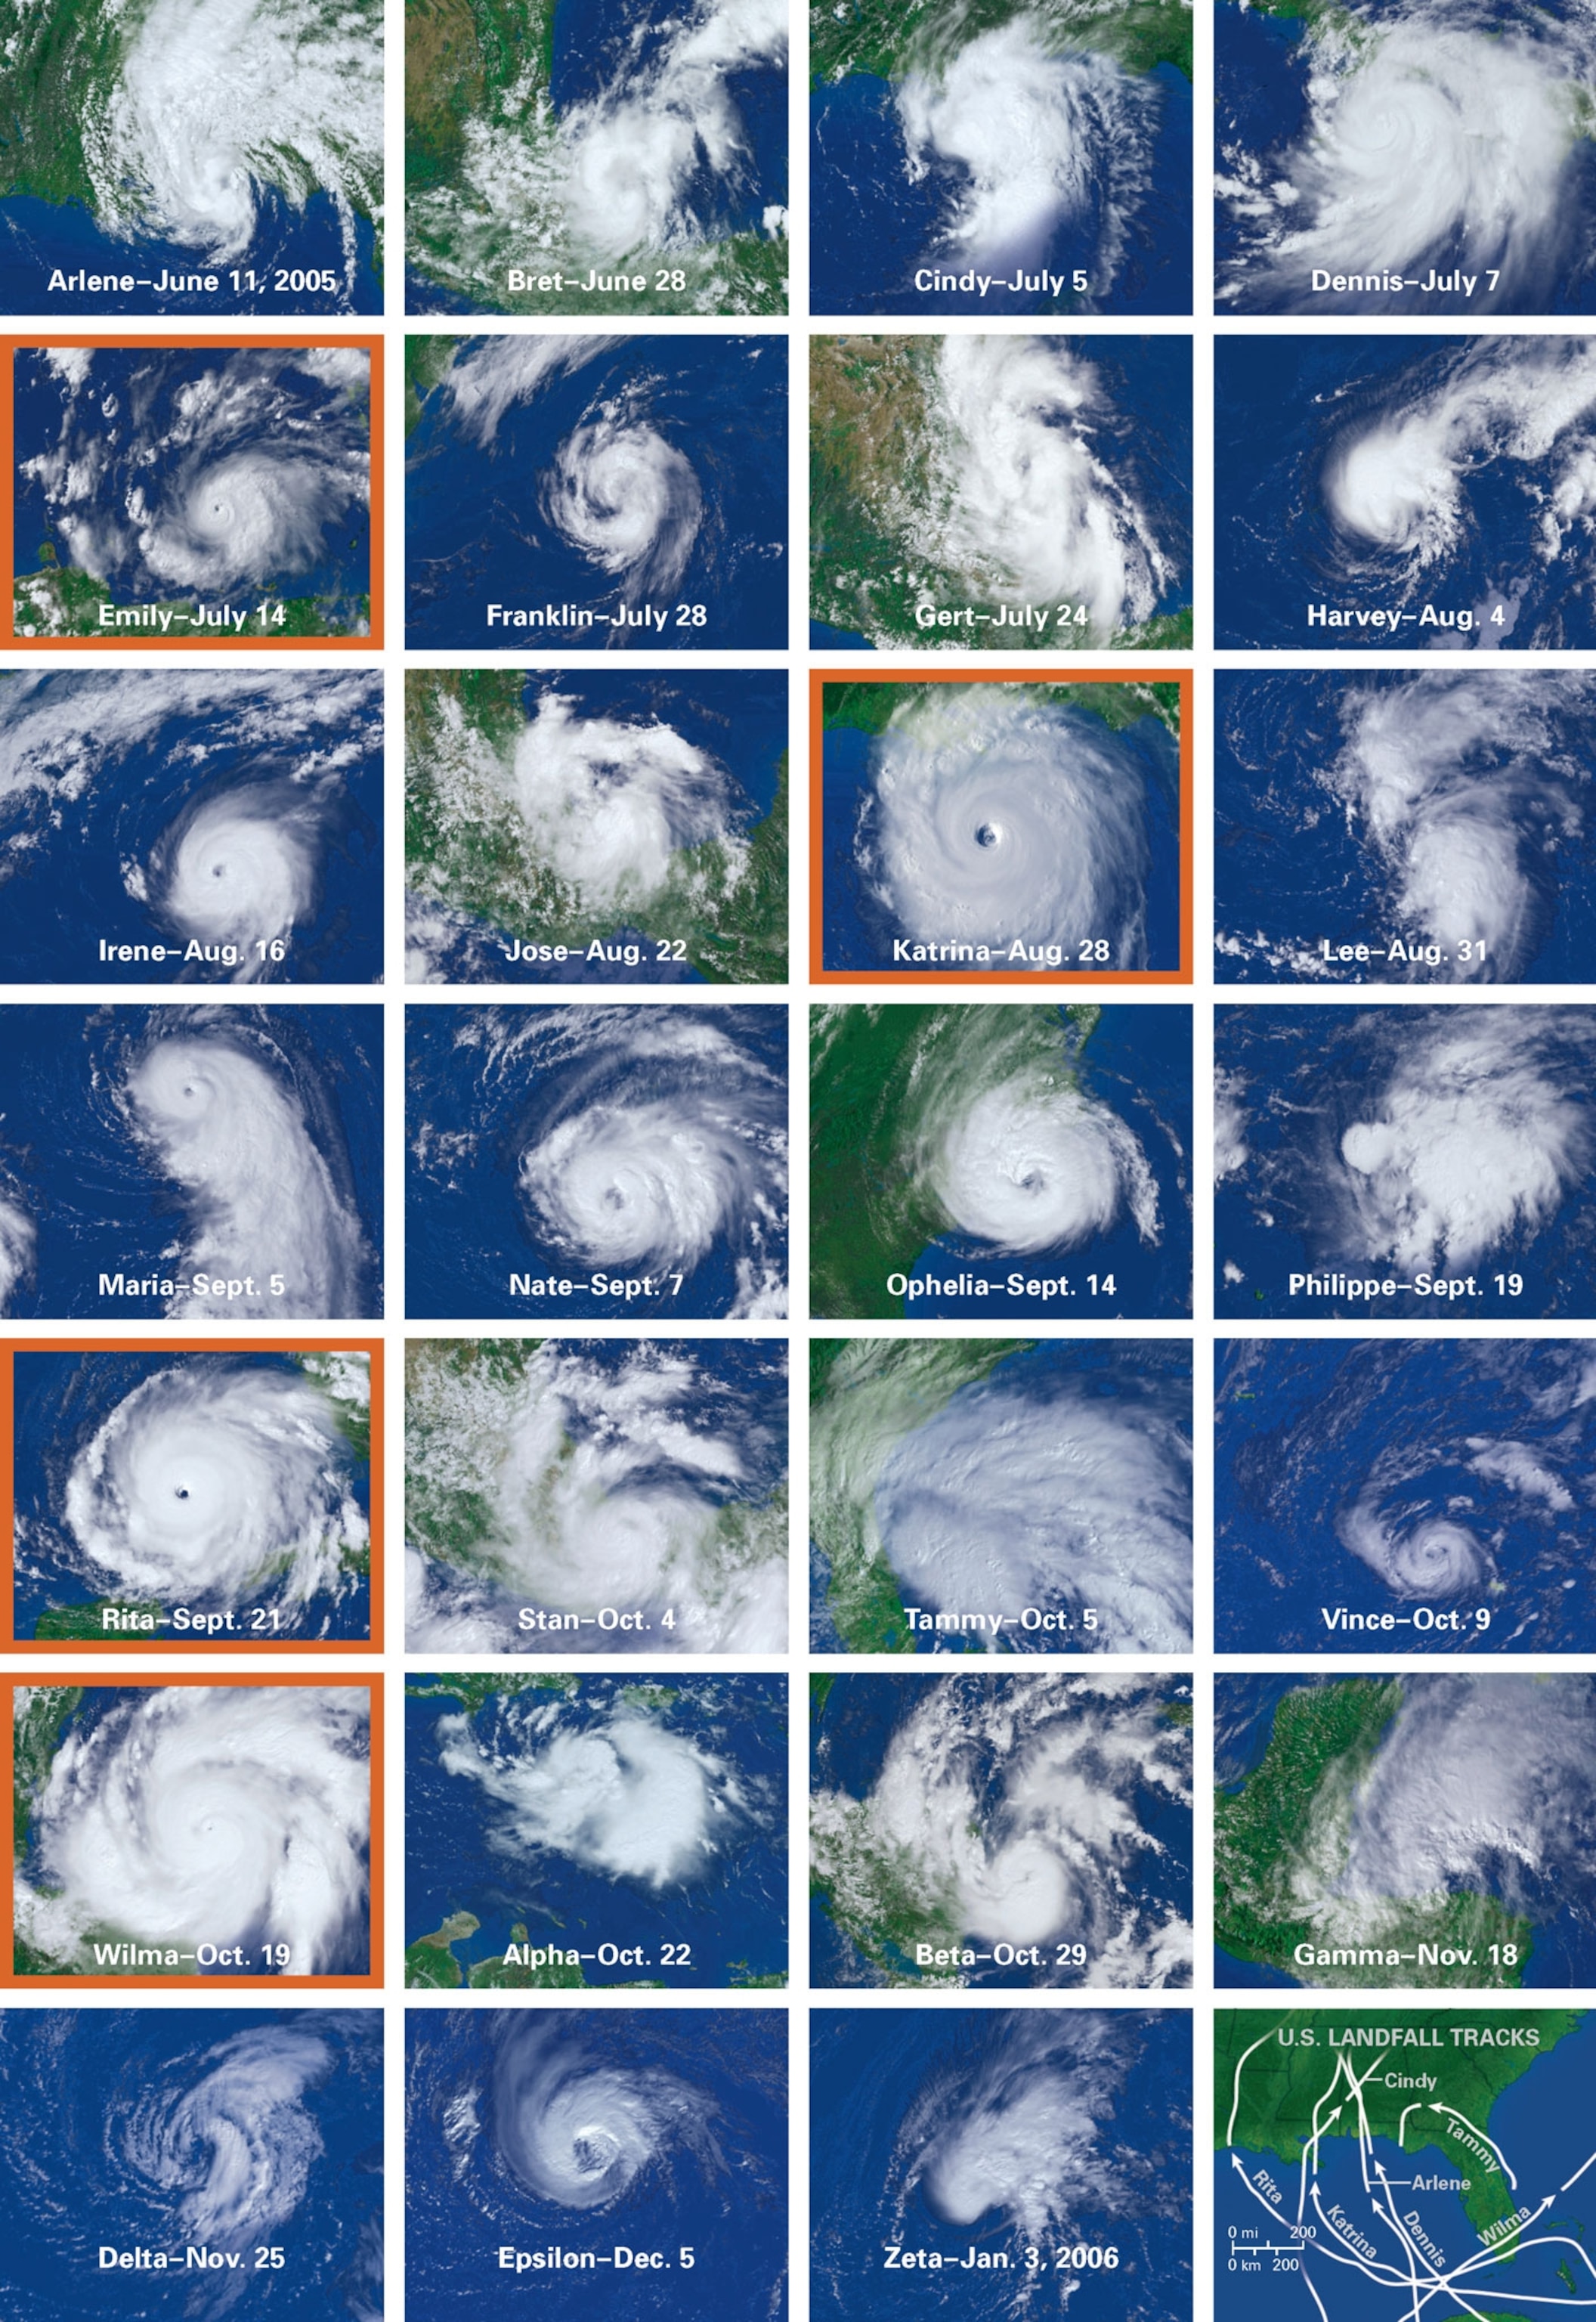
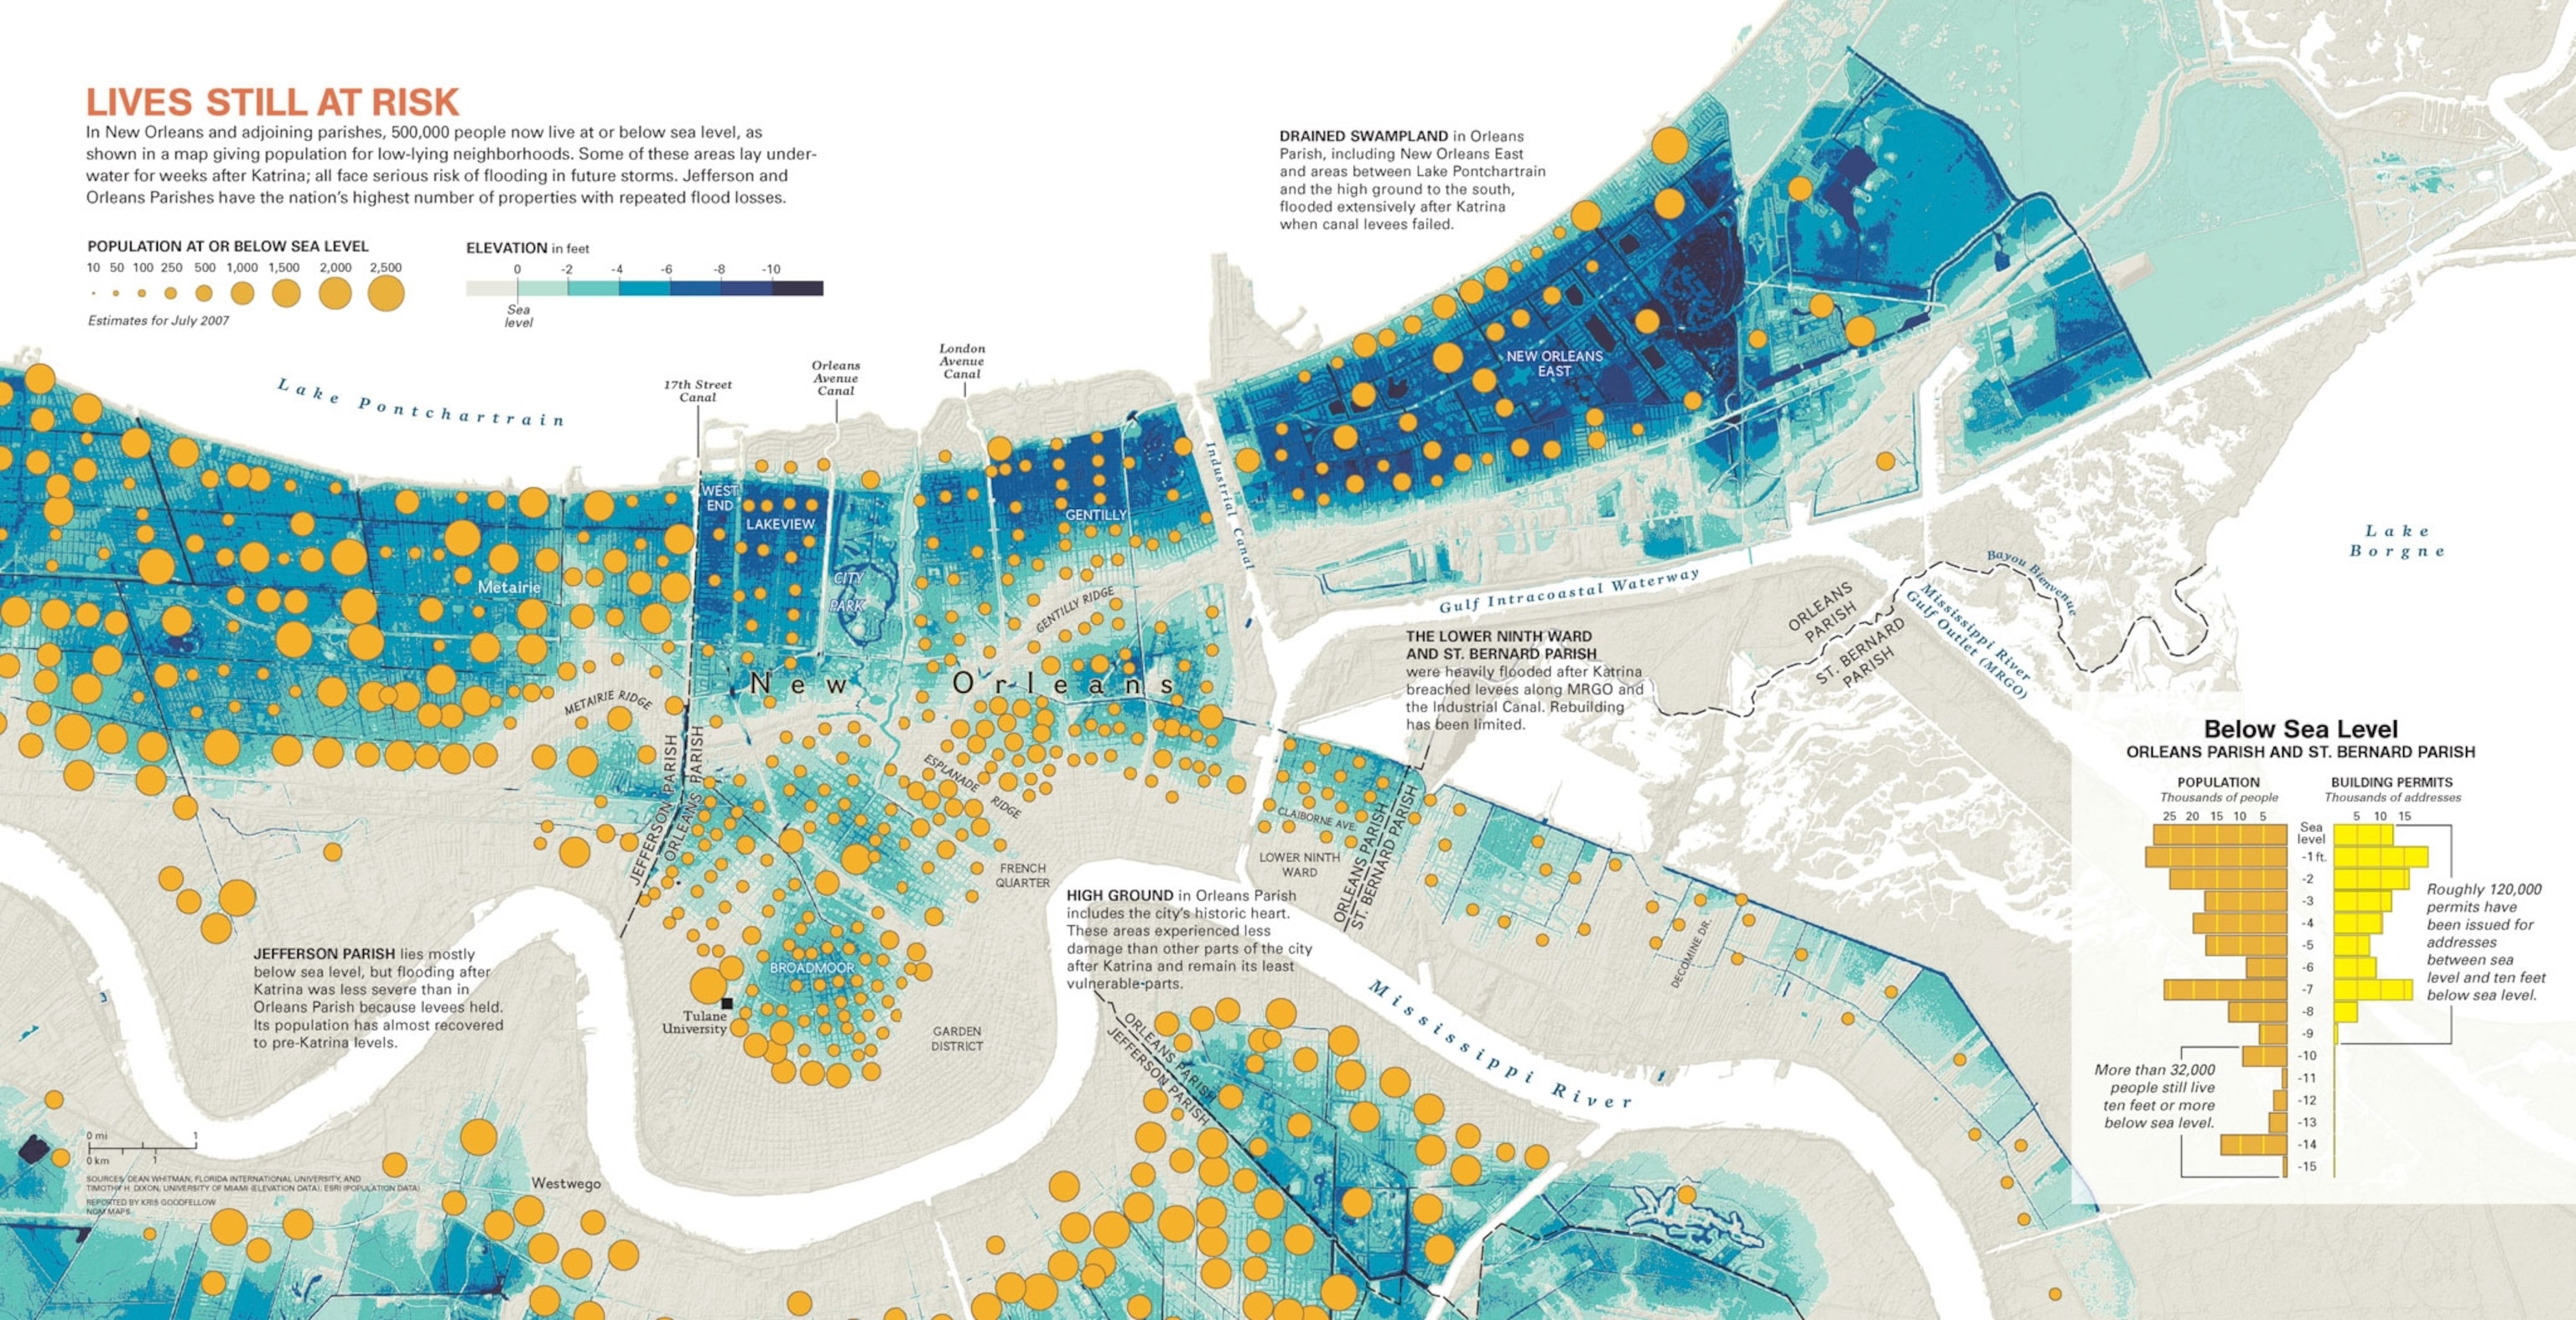
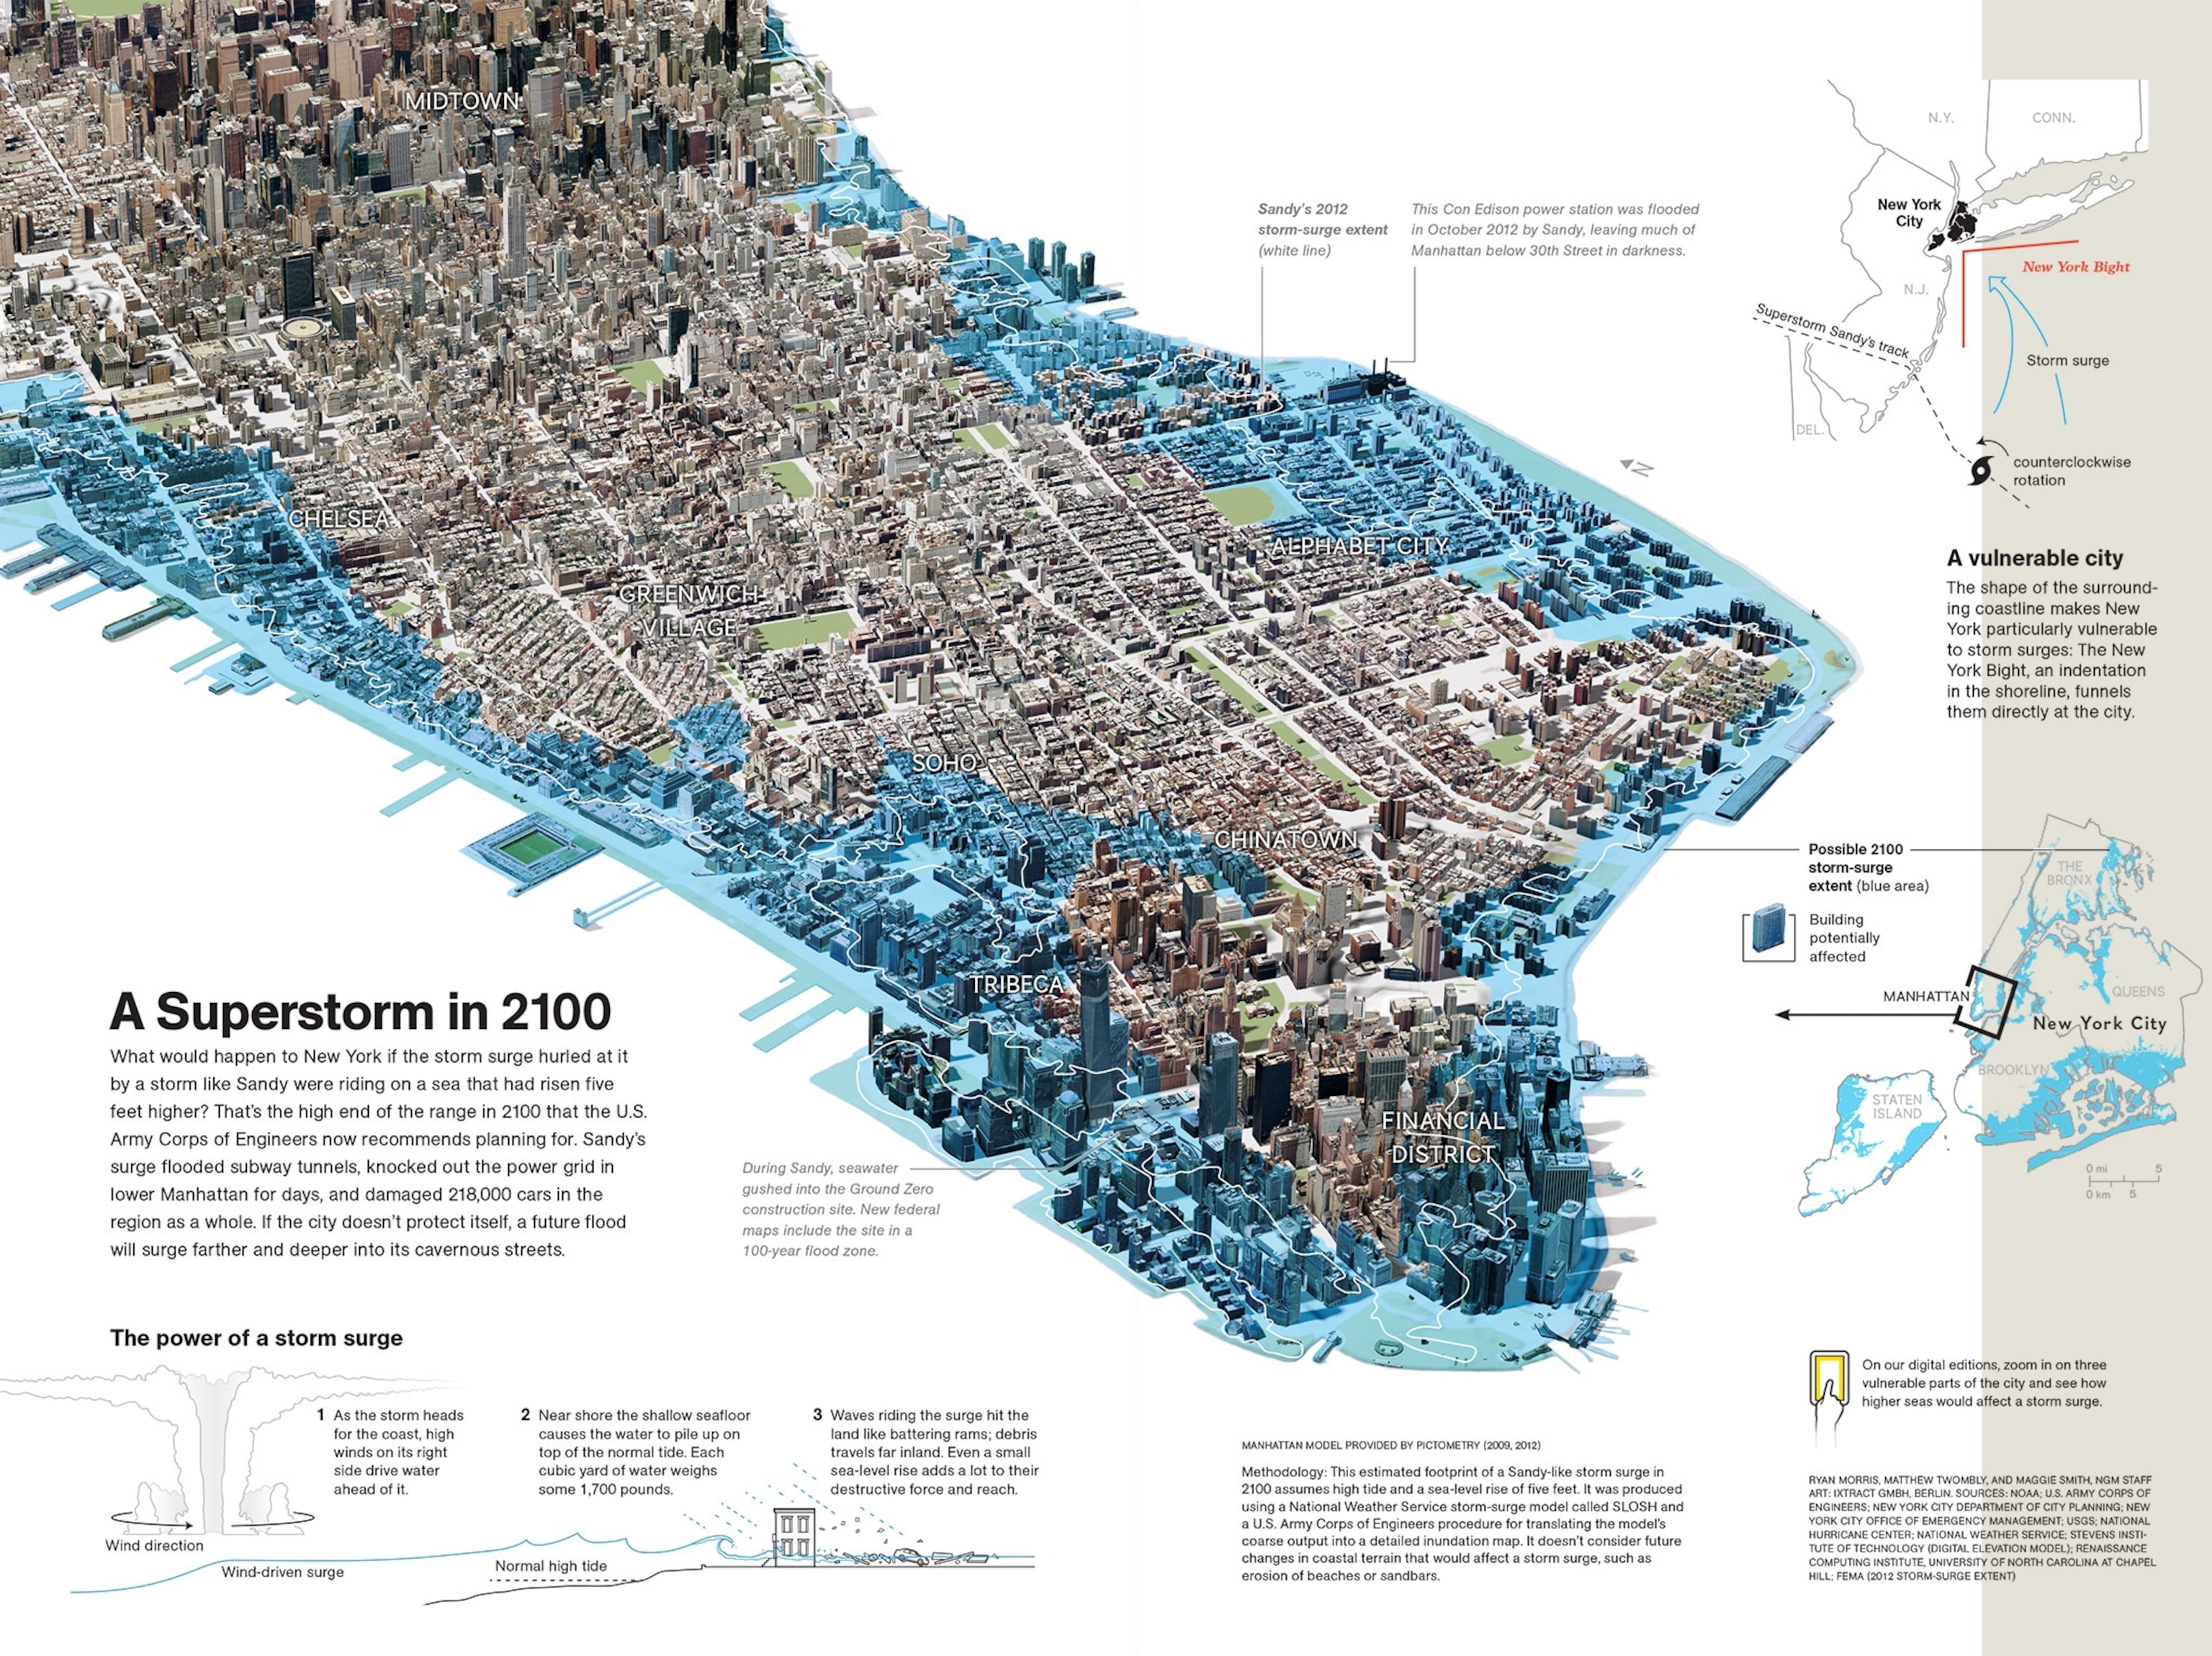
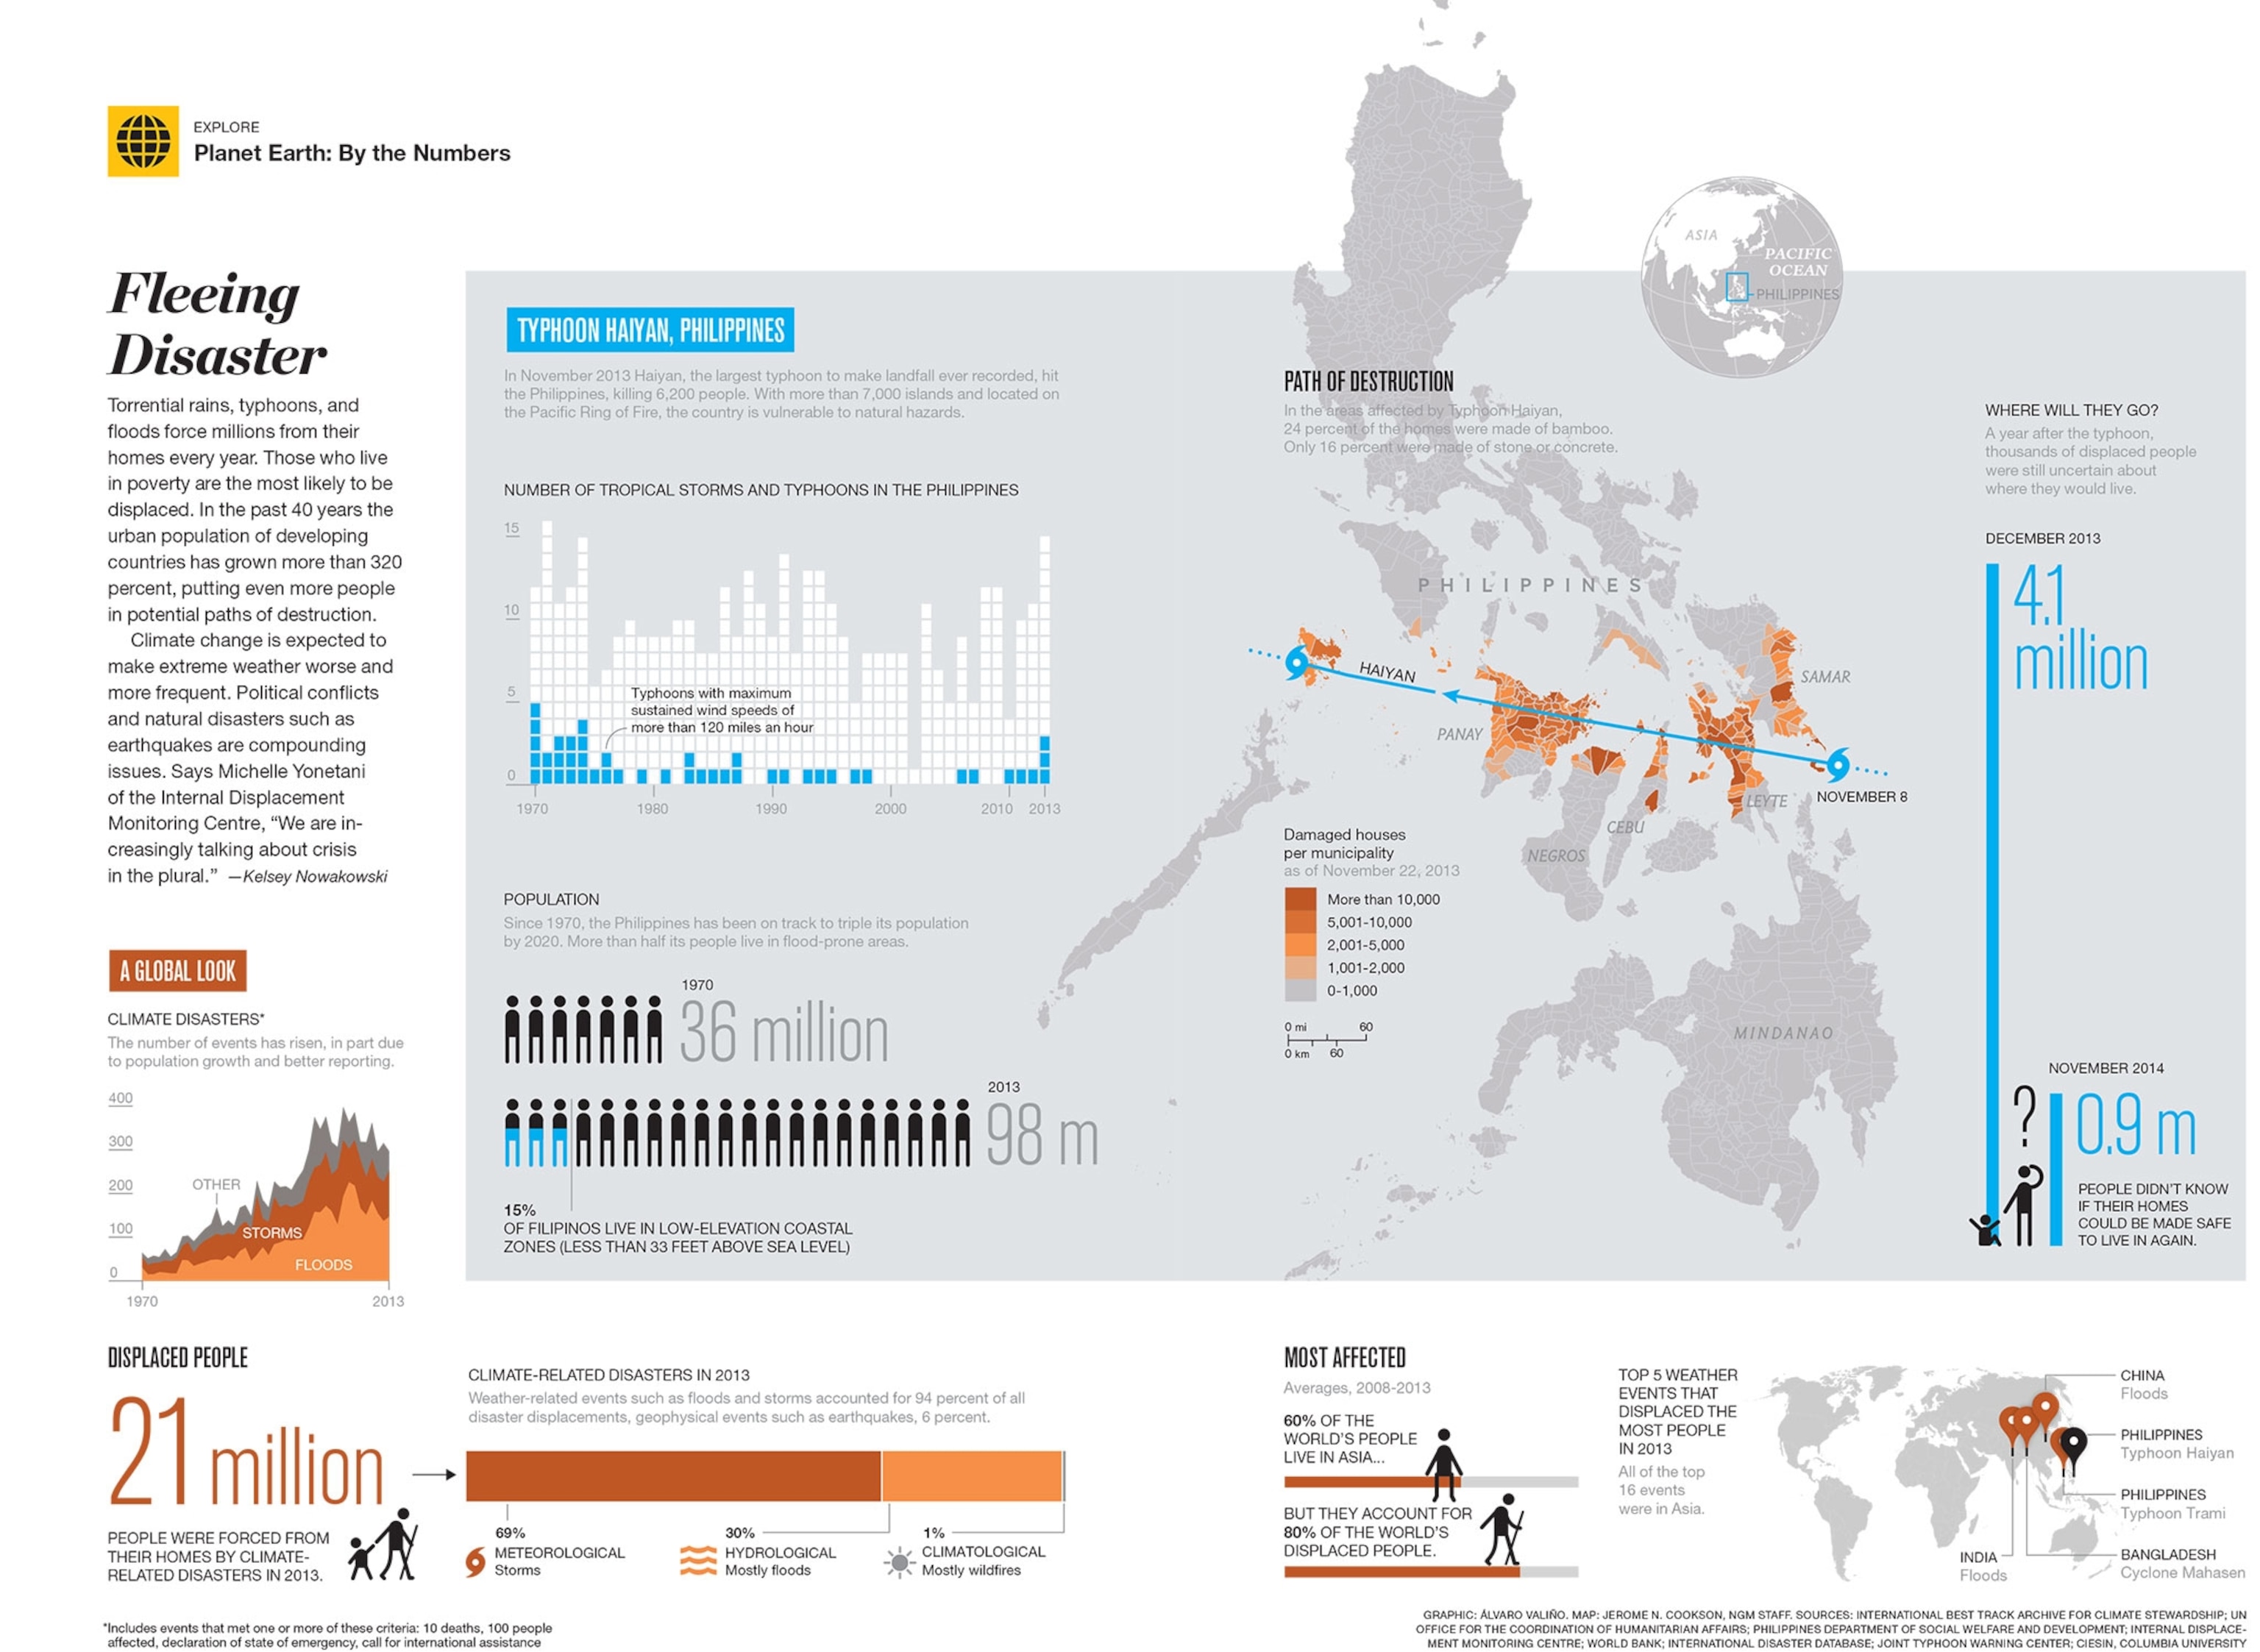
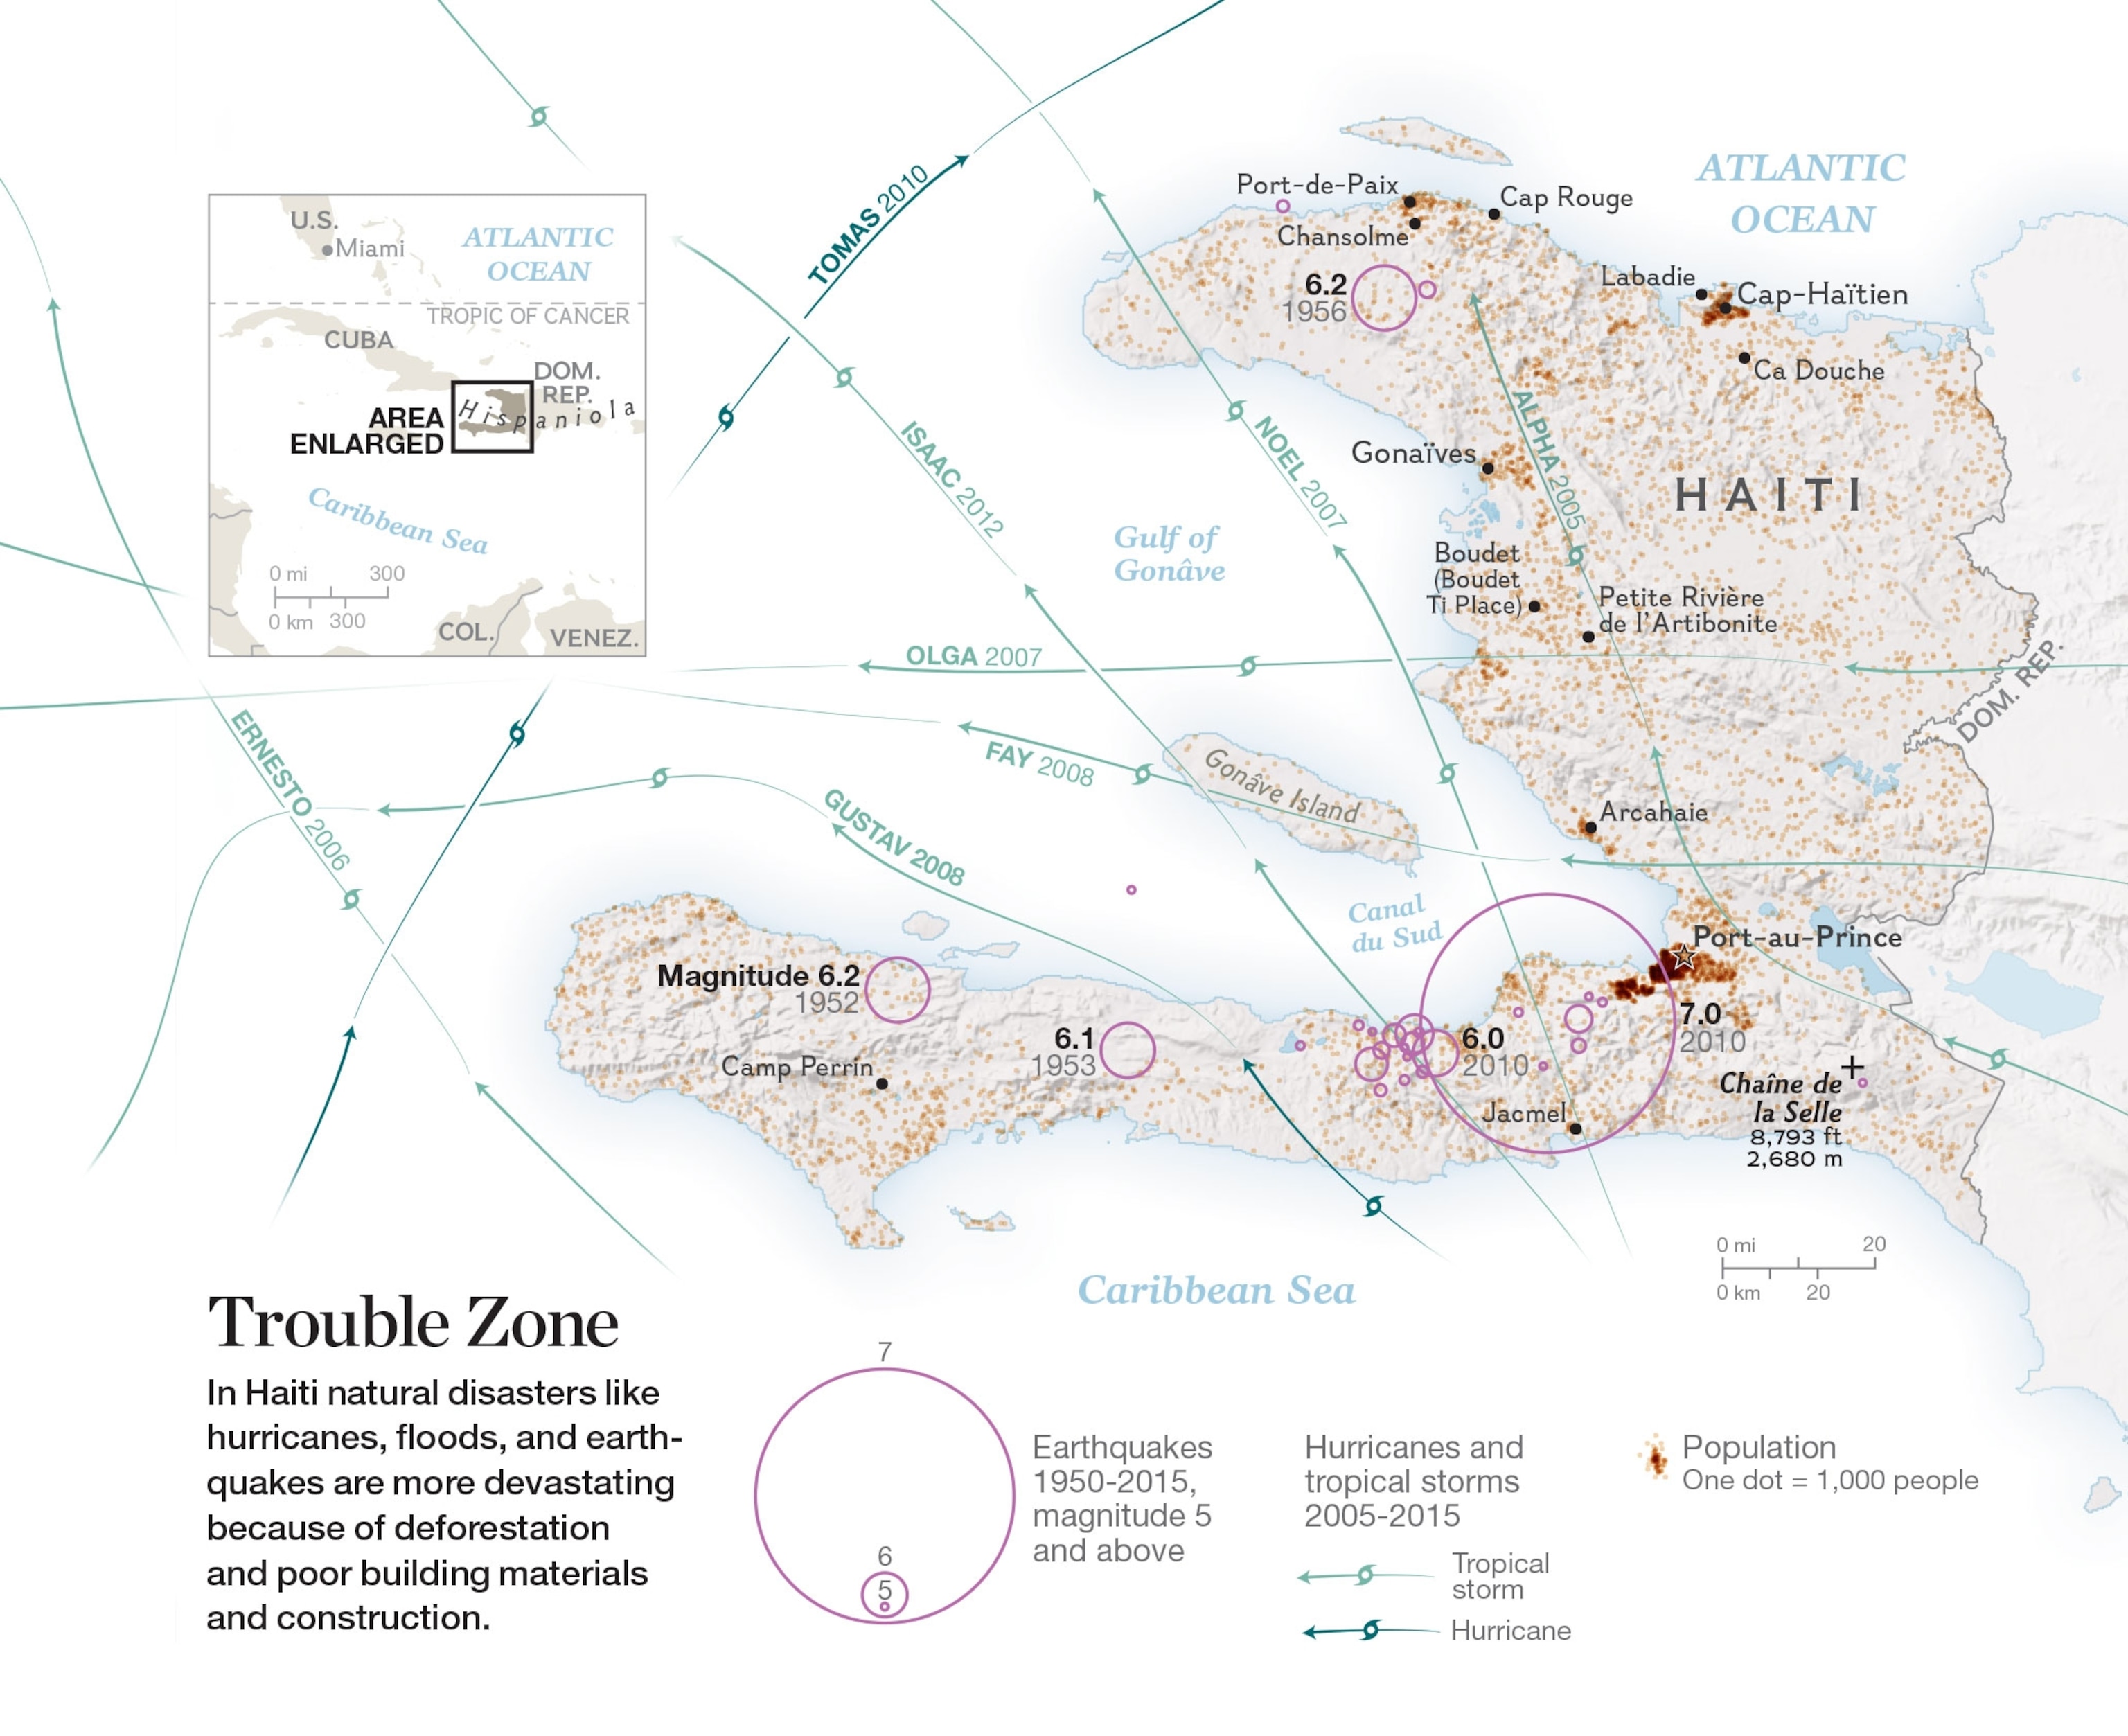
Today, satellites used exclusively for forecasting weather churn out data that allow meteorologists to determine the near-exact landfall of storms. It’s accessible to anyone watching the news or Googling the weather. At National Geographic, maps have shifted from charting the path of major storms, as early ones did, toward providing context and analysis of its damage—from the evacuee disbursement after Hurricane Katrina to the flood warning system during Hurricane Harvey.
But this progress is intrinsically tied to the open-source style used by agencies like the U.S. government’s National Oceanic and Atmospheric Administration to share their information, says National Geographic’s director of cartography Martin Gamache. Without it, “we’d be going back to the 19th century.”
See a different map from the archive every day by following @NatGeoMaps on Twitter, Instagram, and Facebook.
