Visualizing a Wet, Hot (and Also Very Dry) American Summer
Interactive maps of drought and precipitation show that U.S. weather in 2015 is a study in contrasts.
Data Points is a new series where we explore the world of data visualization, information graphics, and cartography.
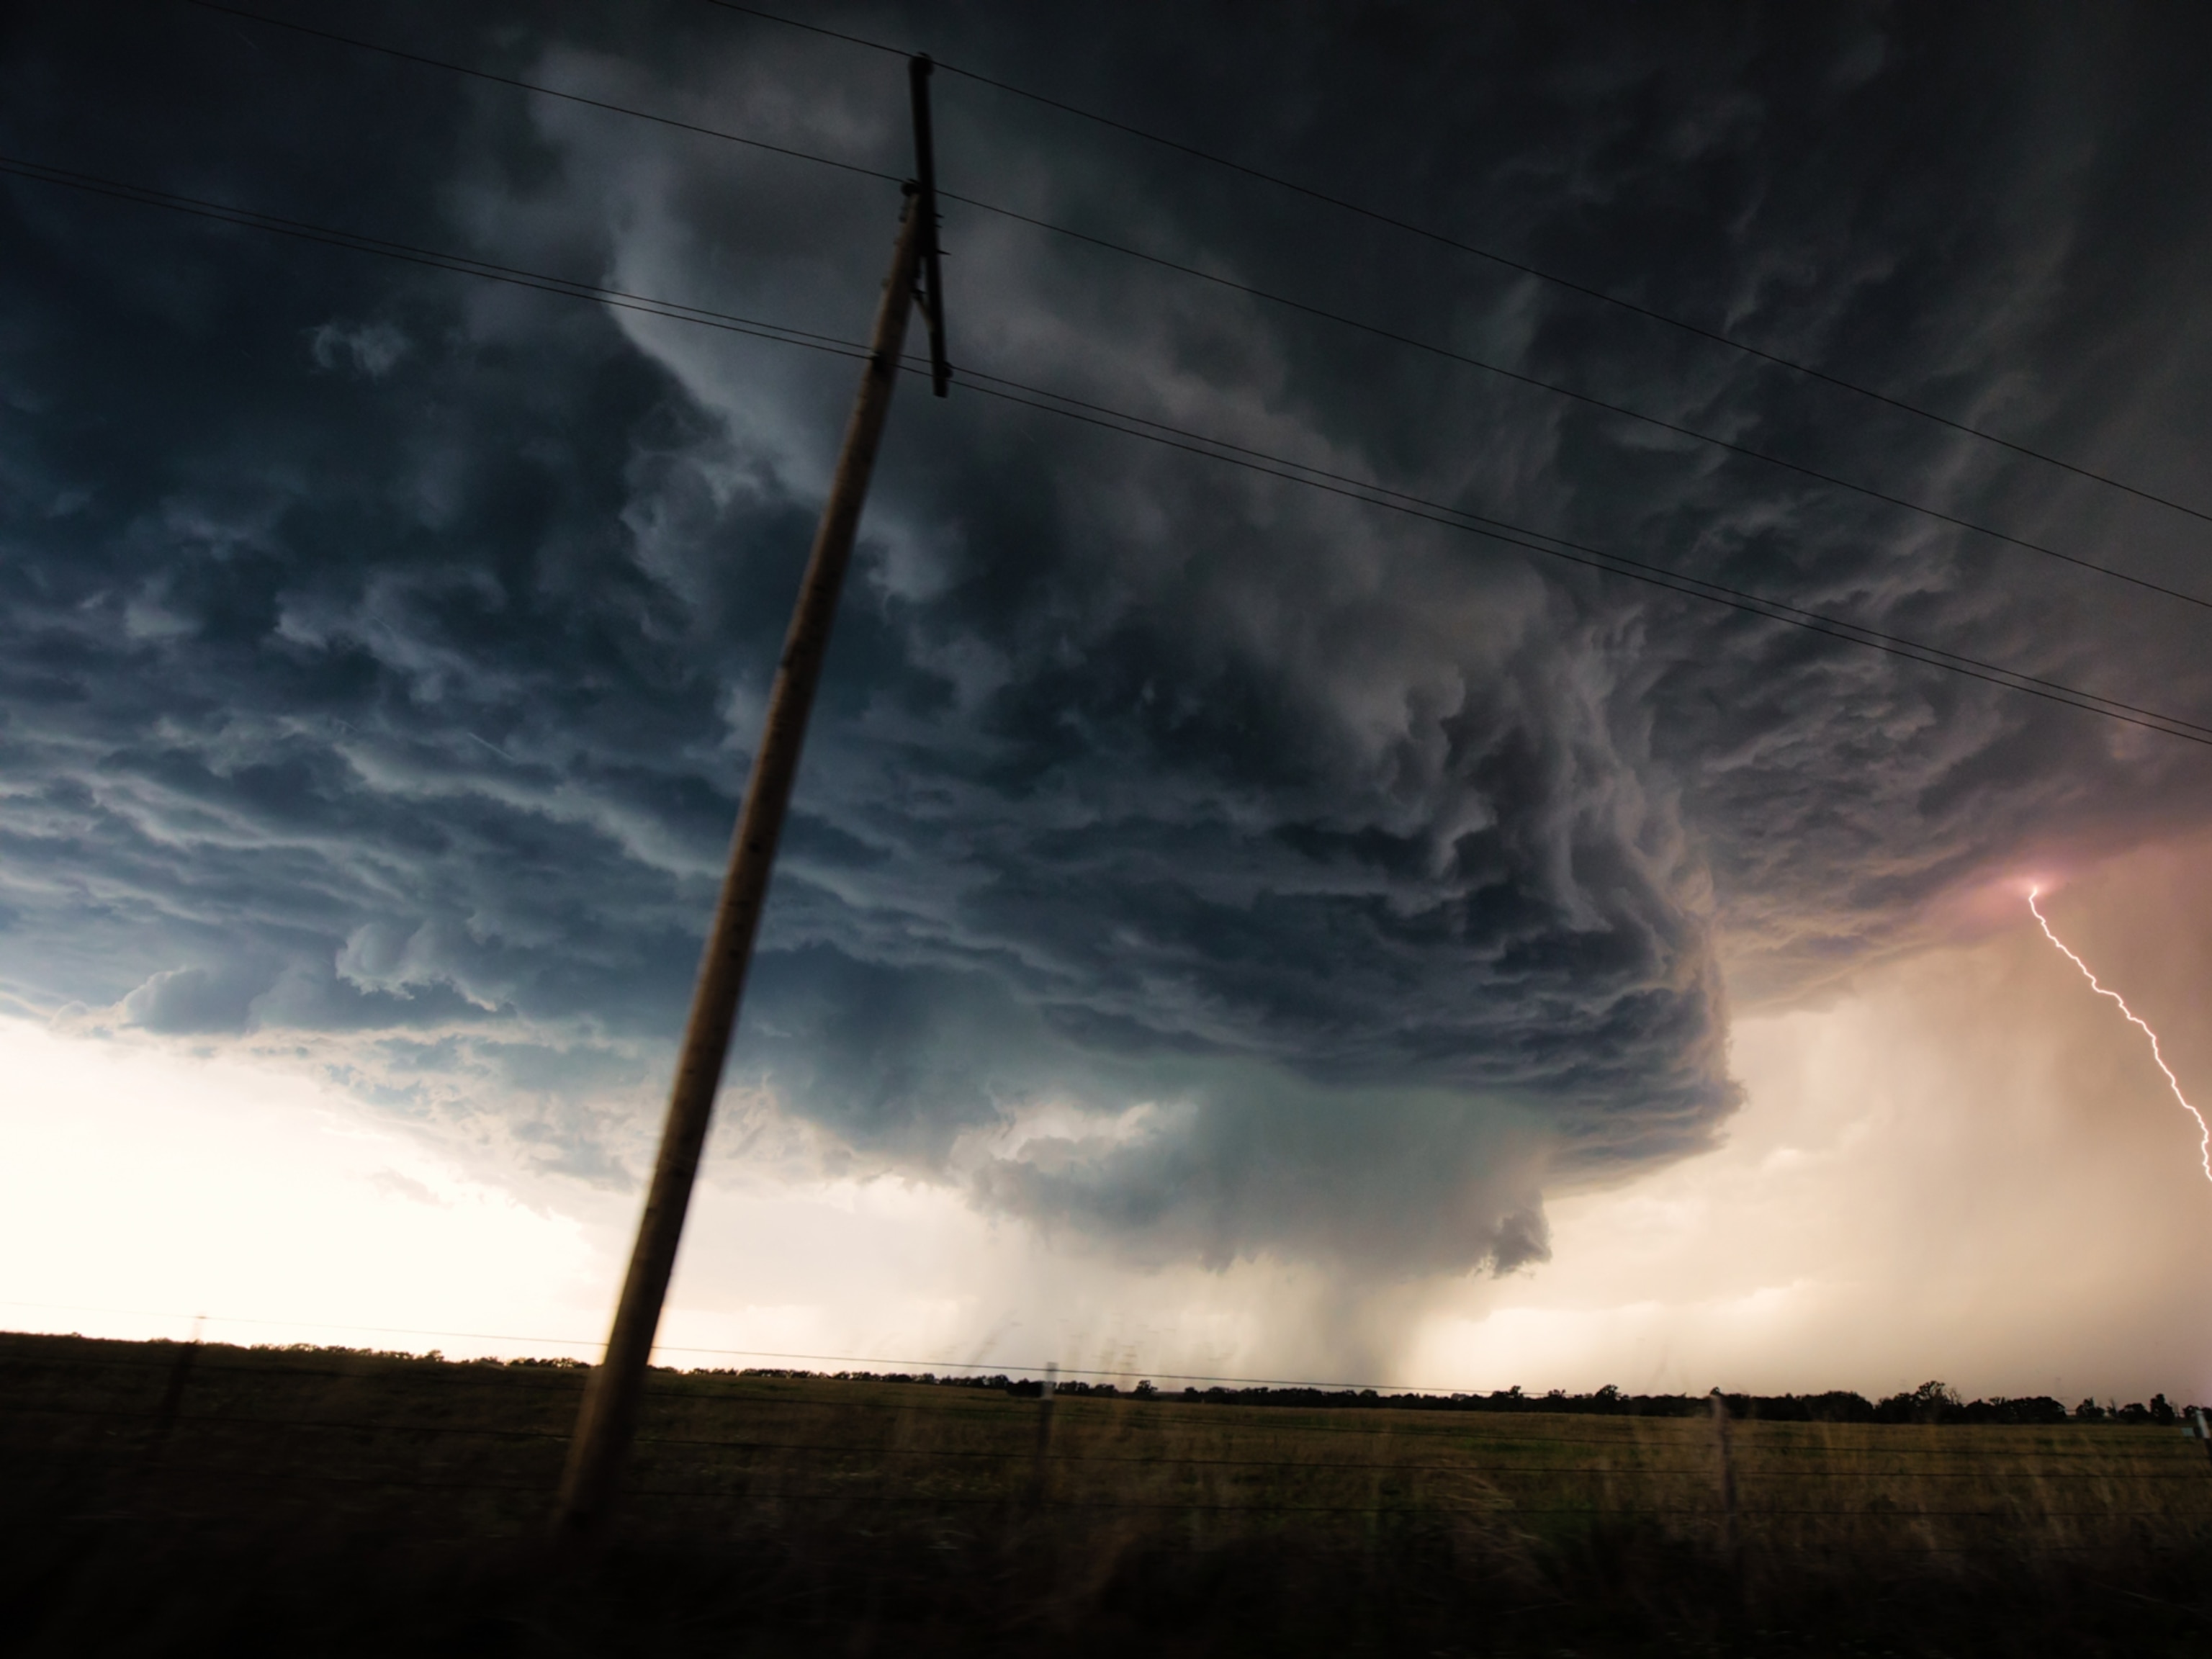
From epic snowfall in the northeastern United States to a record heat wave in western Europe, the Northern Hemisphere—and the U.S. in particular—has experienced dramatic weather in 2015.
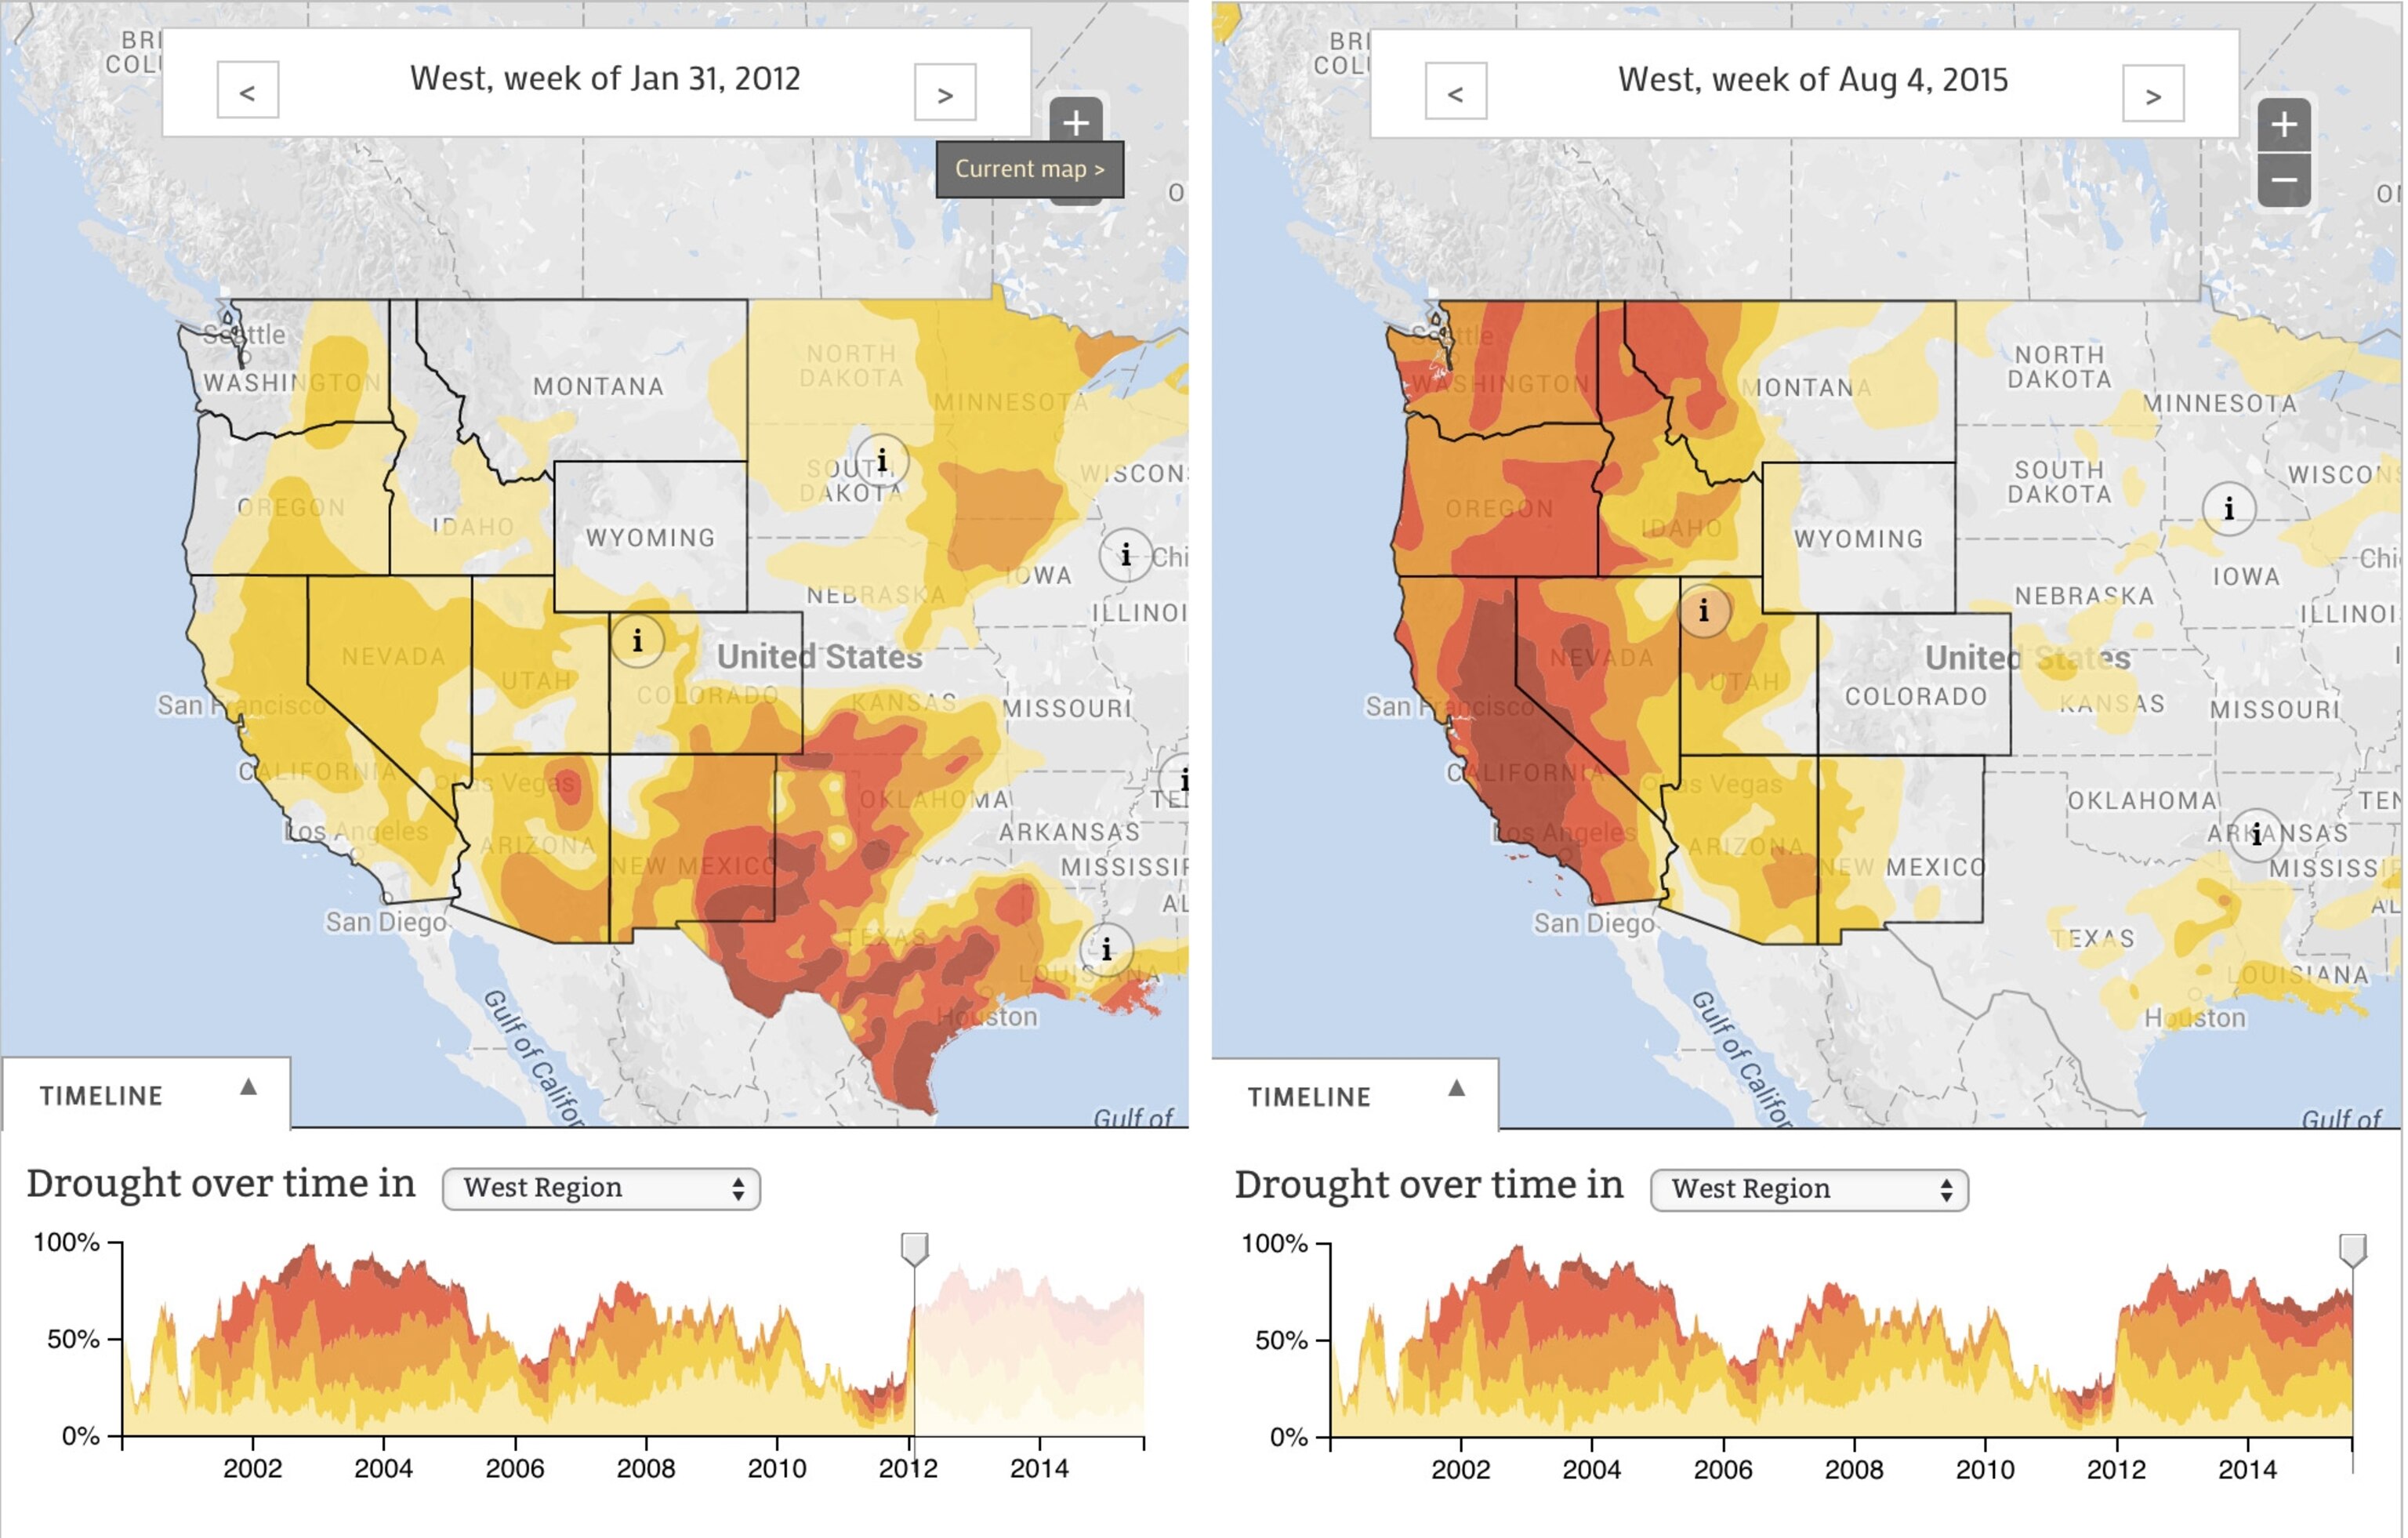
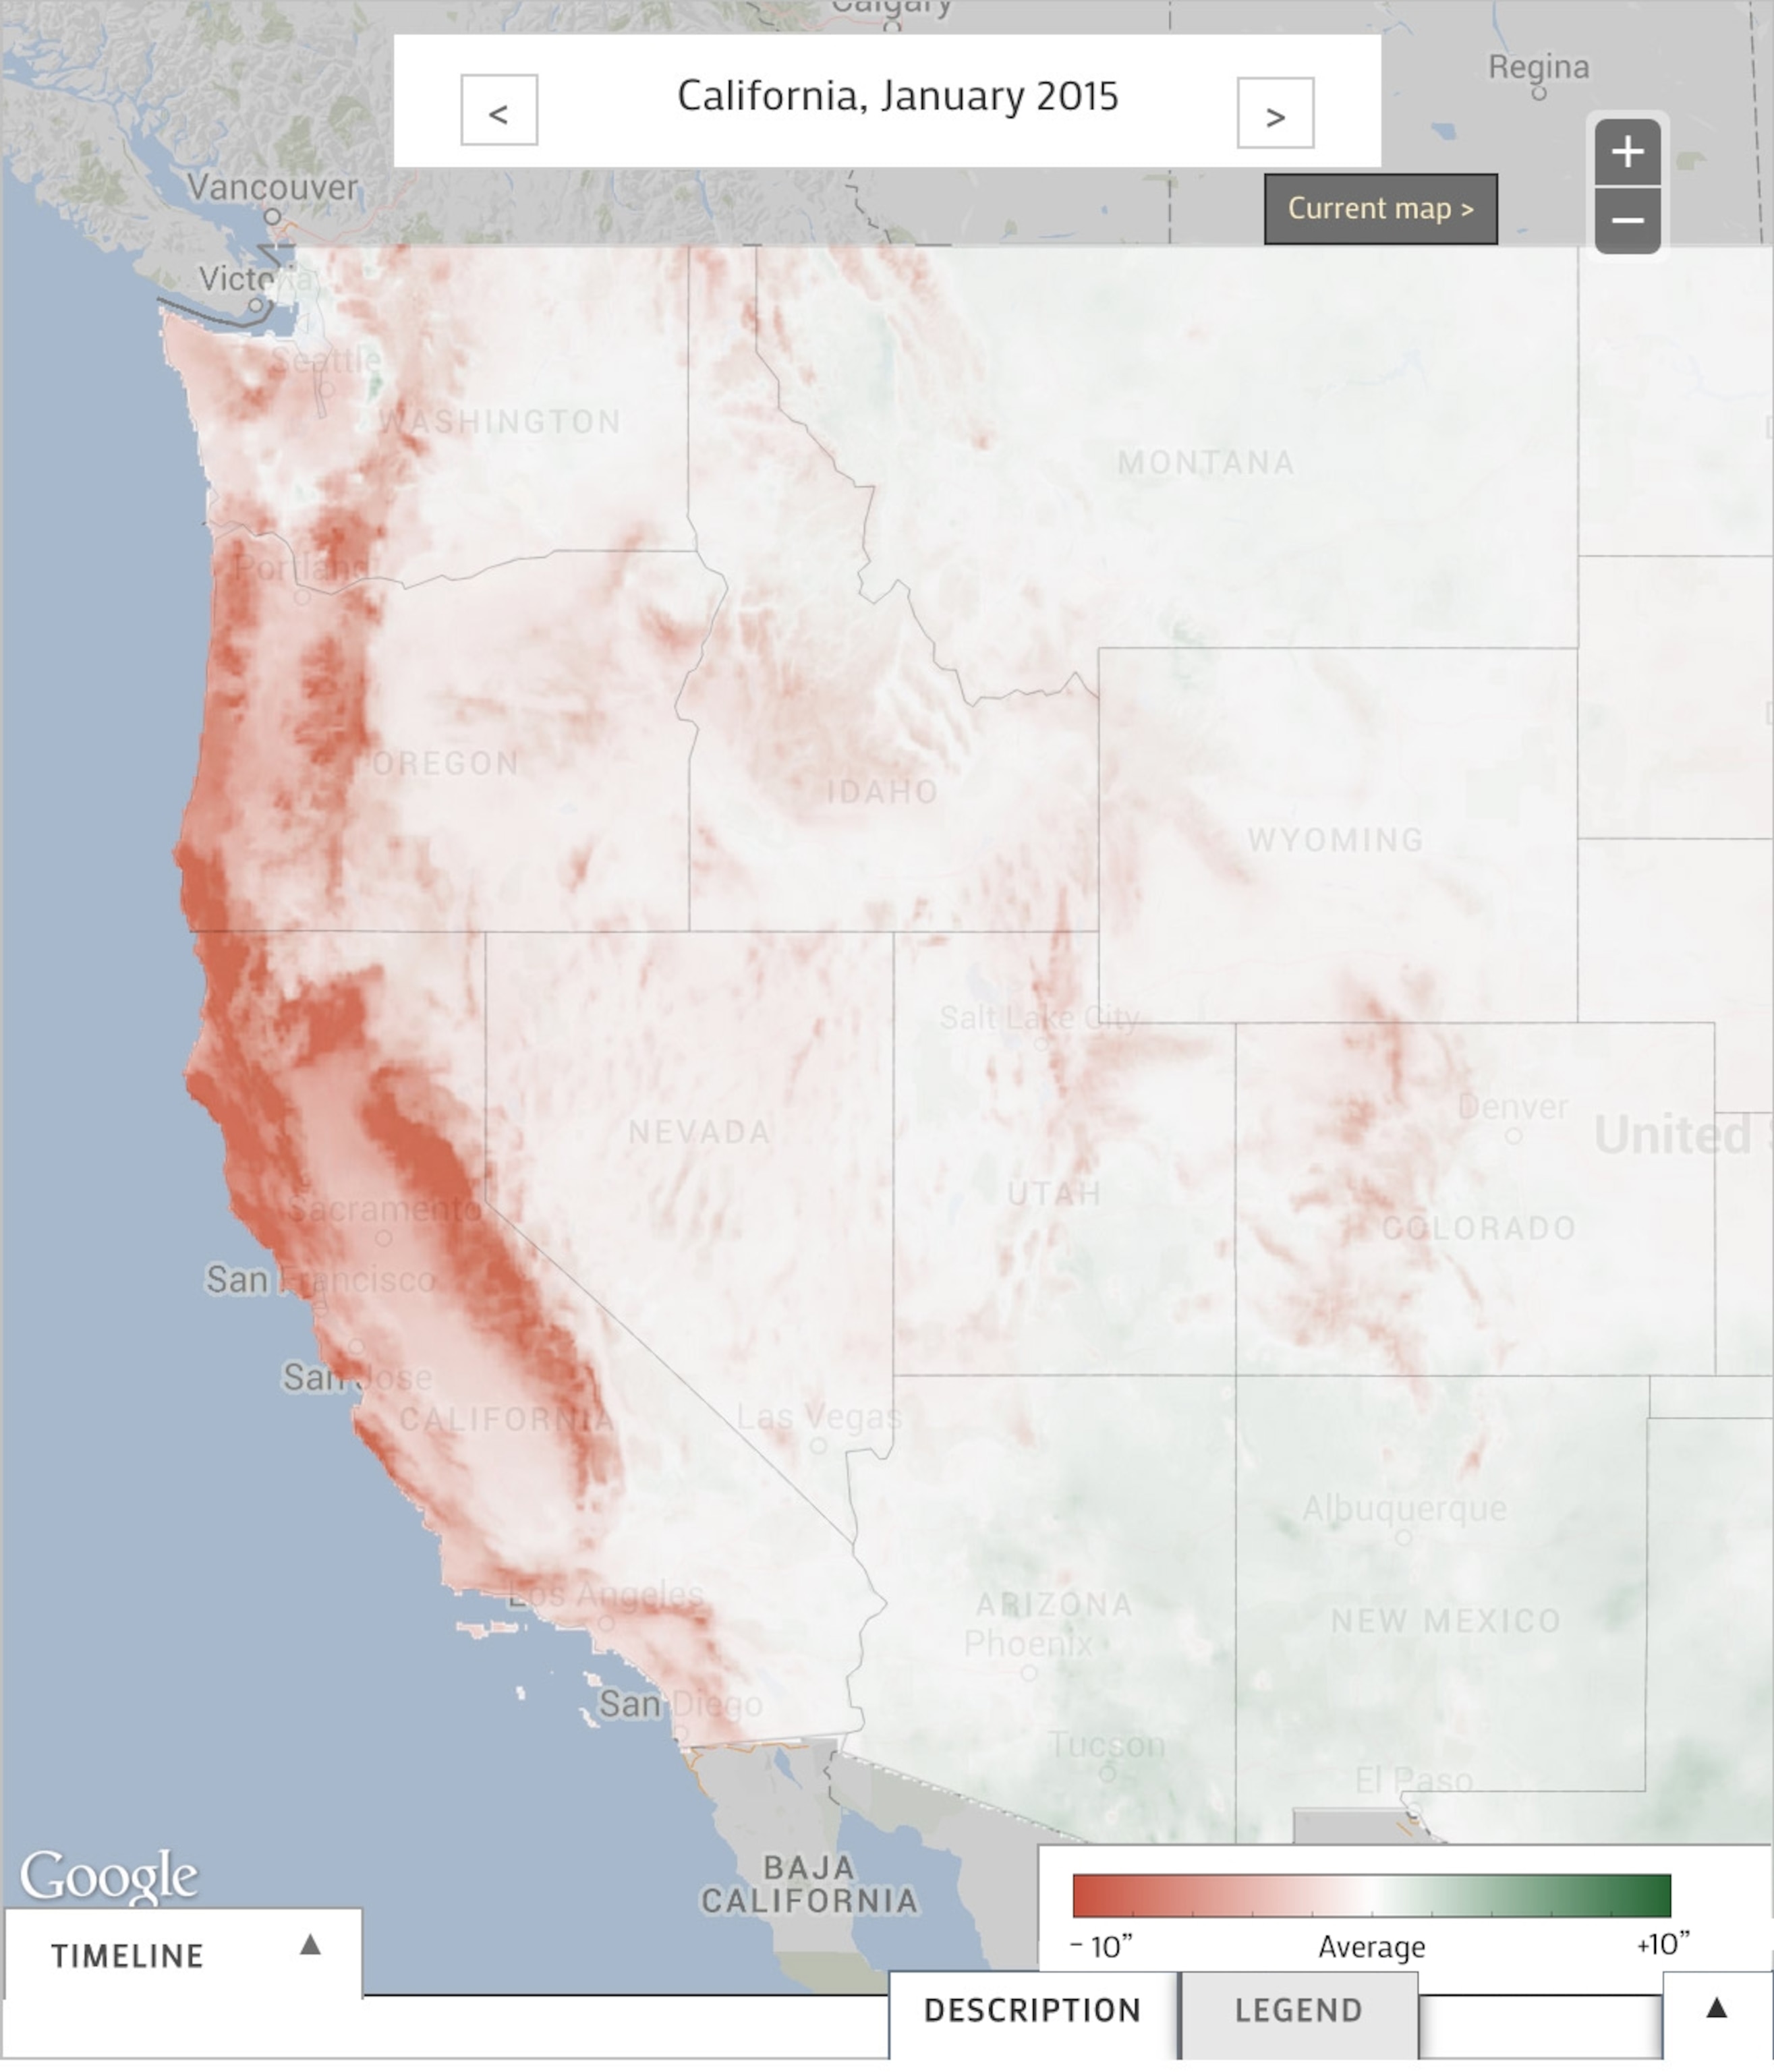
Perhaps nowhere has this been more evident than in the western U.S., where California is in the fourth year of its worst drought on record. Yet in late July, the southern part of the state was drenched by torrential rains that washed away two interstate highway bridges. That same week, on another interstate about a hundred miles away, a drought-fueled wildfire torched 20 cars as their panicked drivers fled.
To Keep Up, You're Going to Need a Scorecard
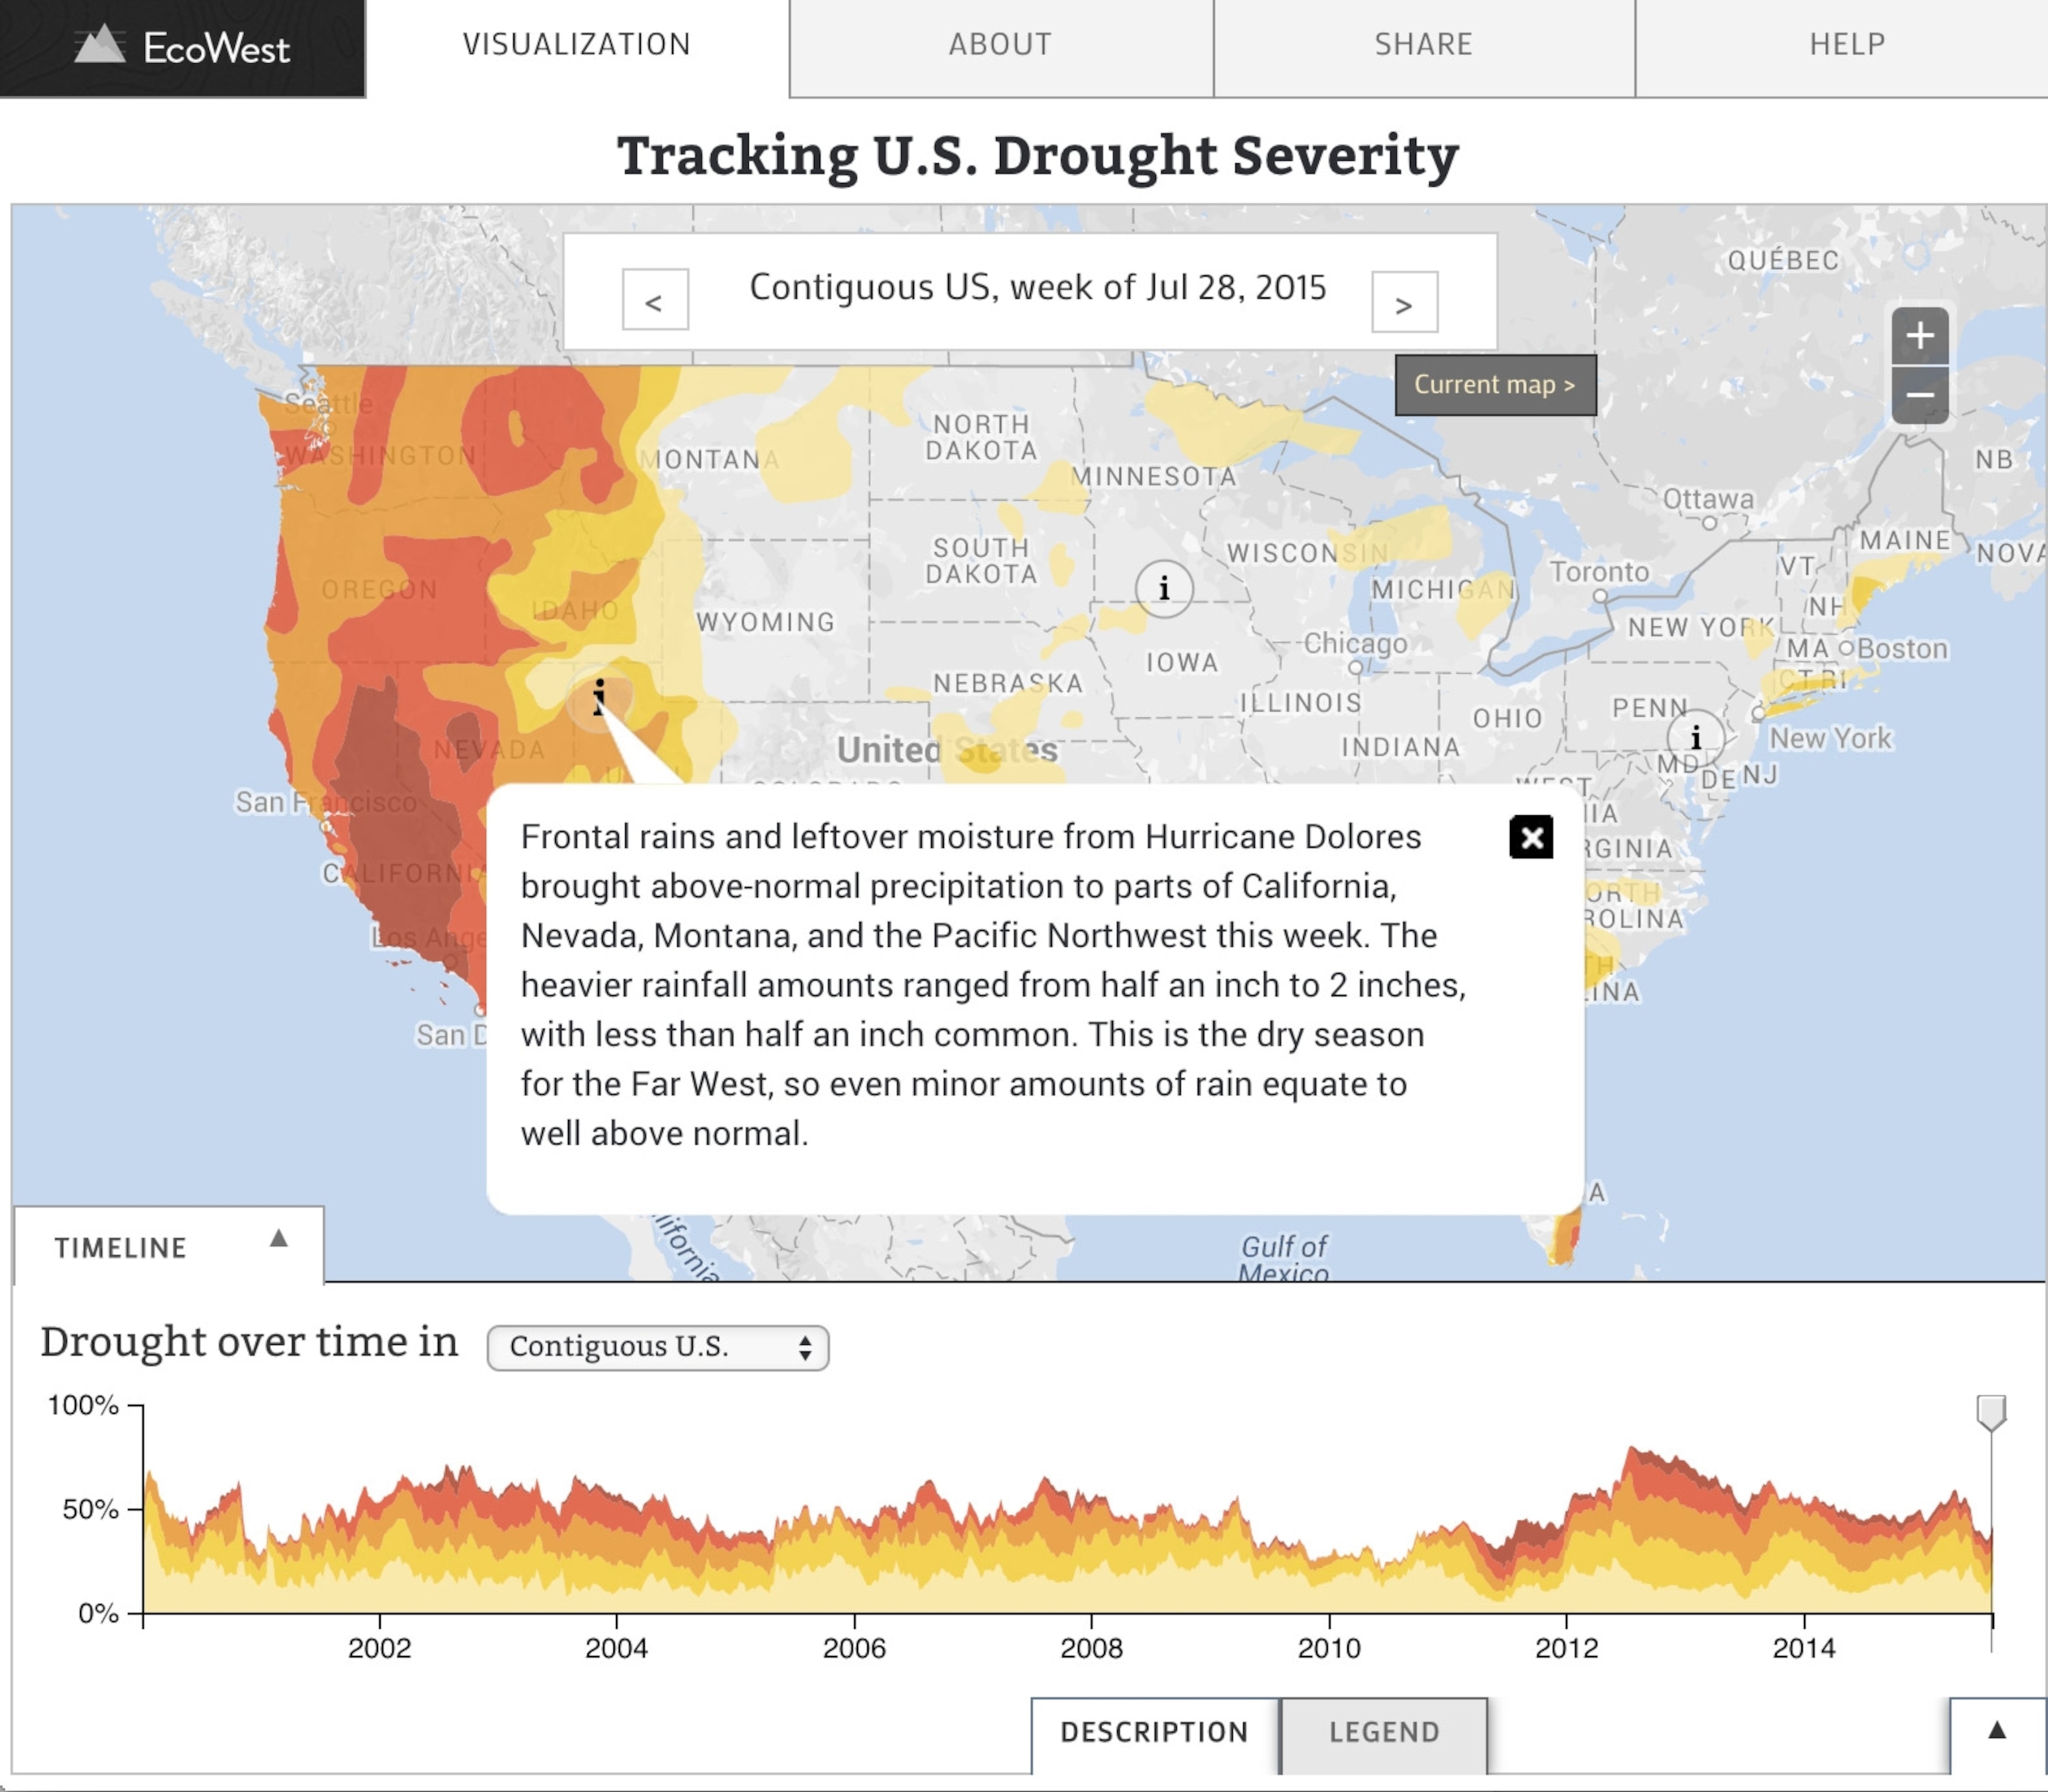
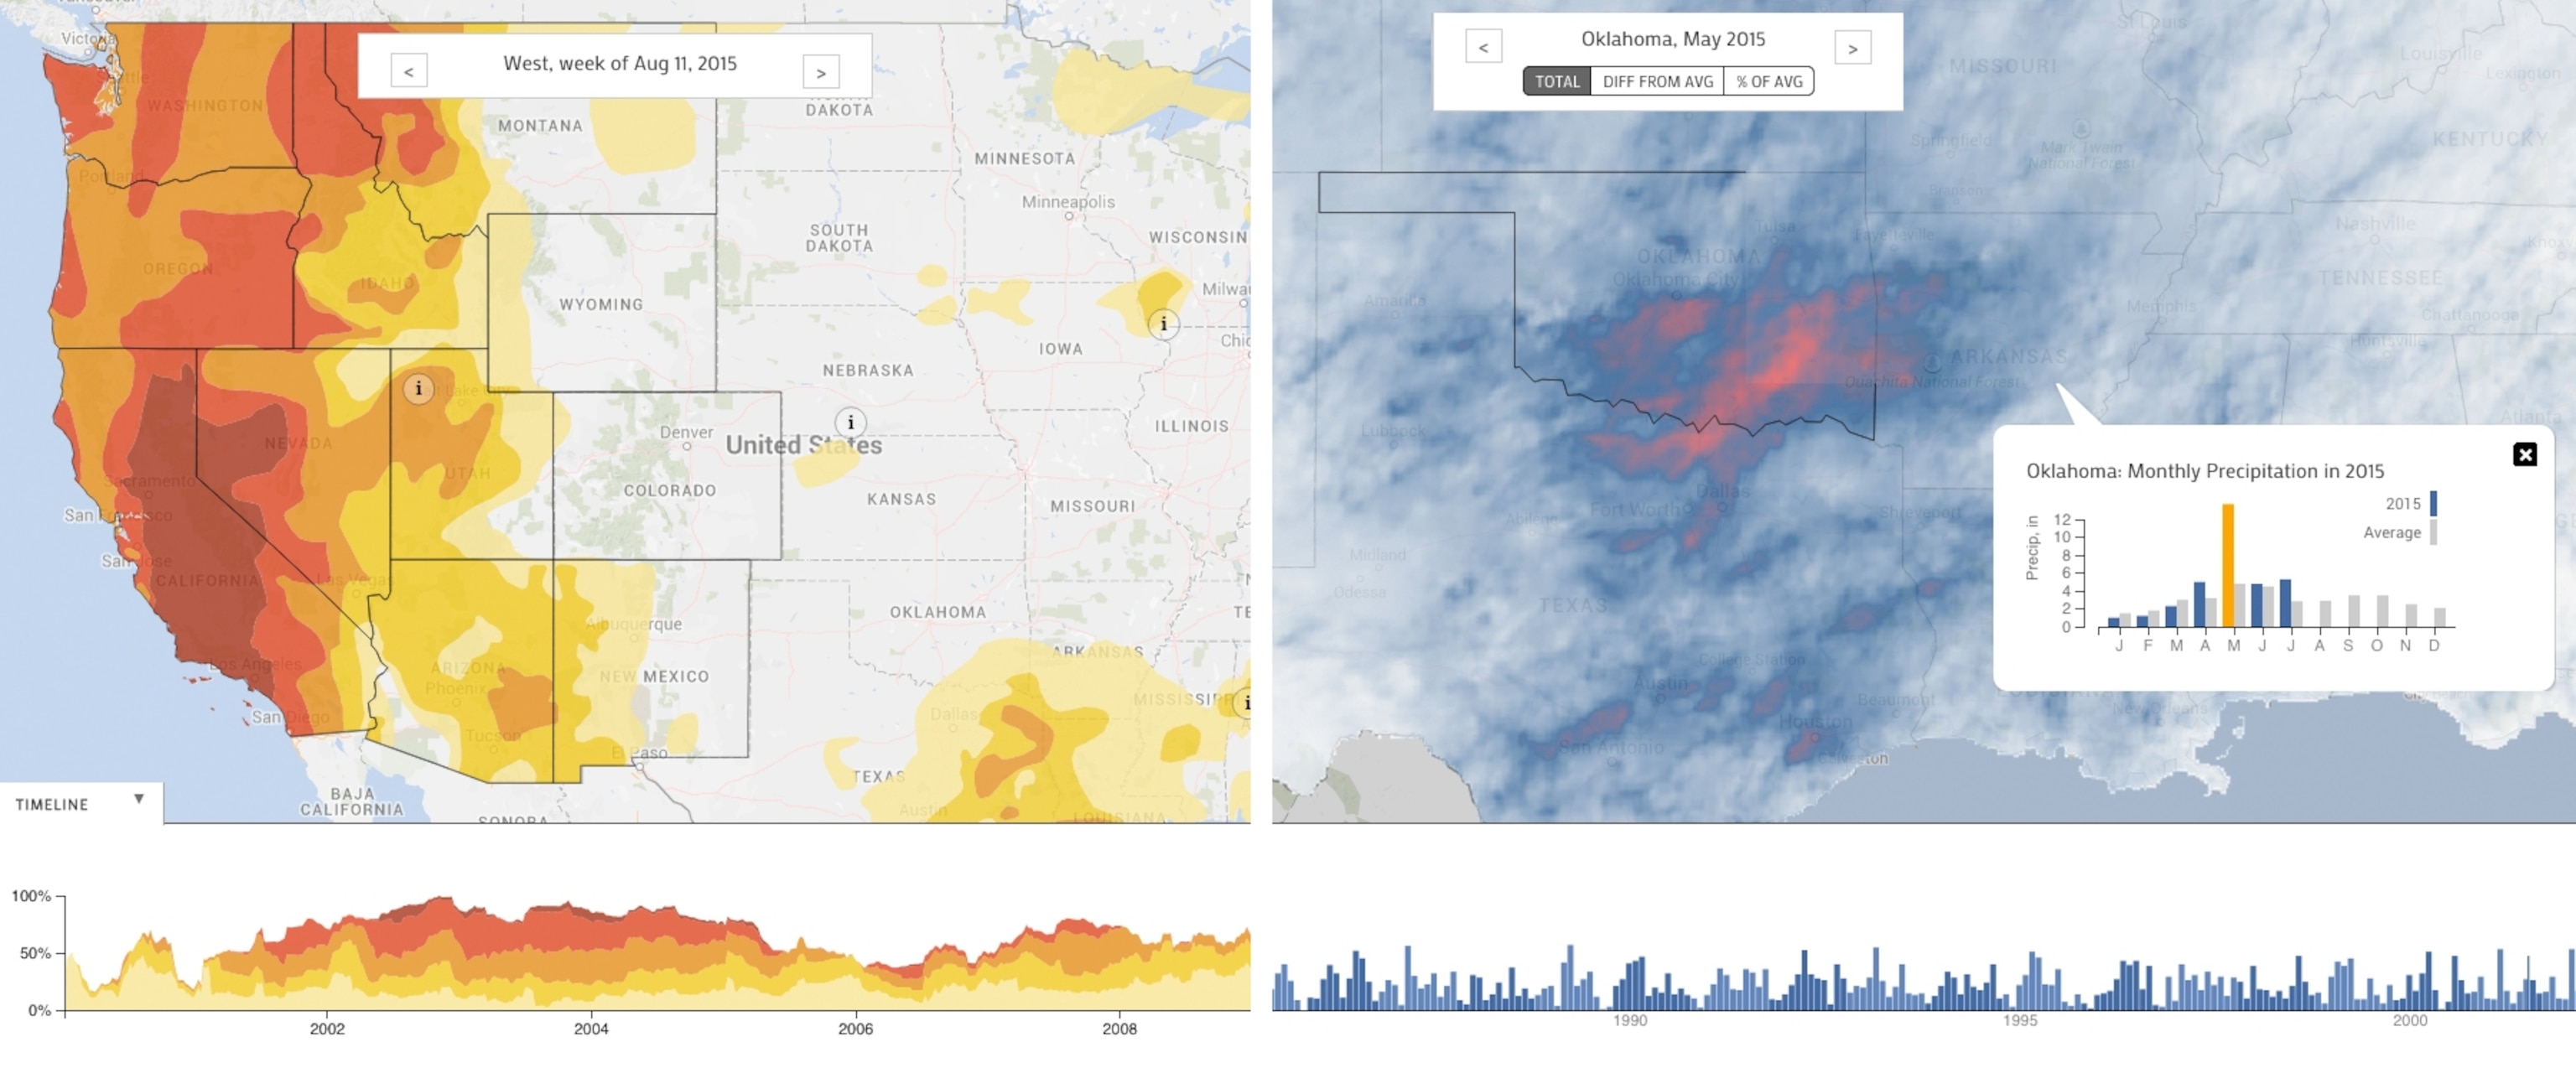
To better track climatic conditions around the West and the country as a whole, my team at the Bill Lane Center for the American West at Stanford University, together with collaborators at EcoWest, have published two interactive graphics that track changes in two crucial drought indicators.
Tracking a Western Drought That Won't Quit
More than 70 percent of California is now in "extreme" drought, and nearly half of it is in the even more drastic "exceptional" category, as defined by the U.S. Drought Monitor. The city of Los Angeles is paying residents millions to rip out lawns. Governor Jerry Brown has ordered water cutbacks for some of the state's most senior rights holders. And last year the state passed historic legislation aimed at containing the runaway pumping of groundwater.
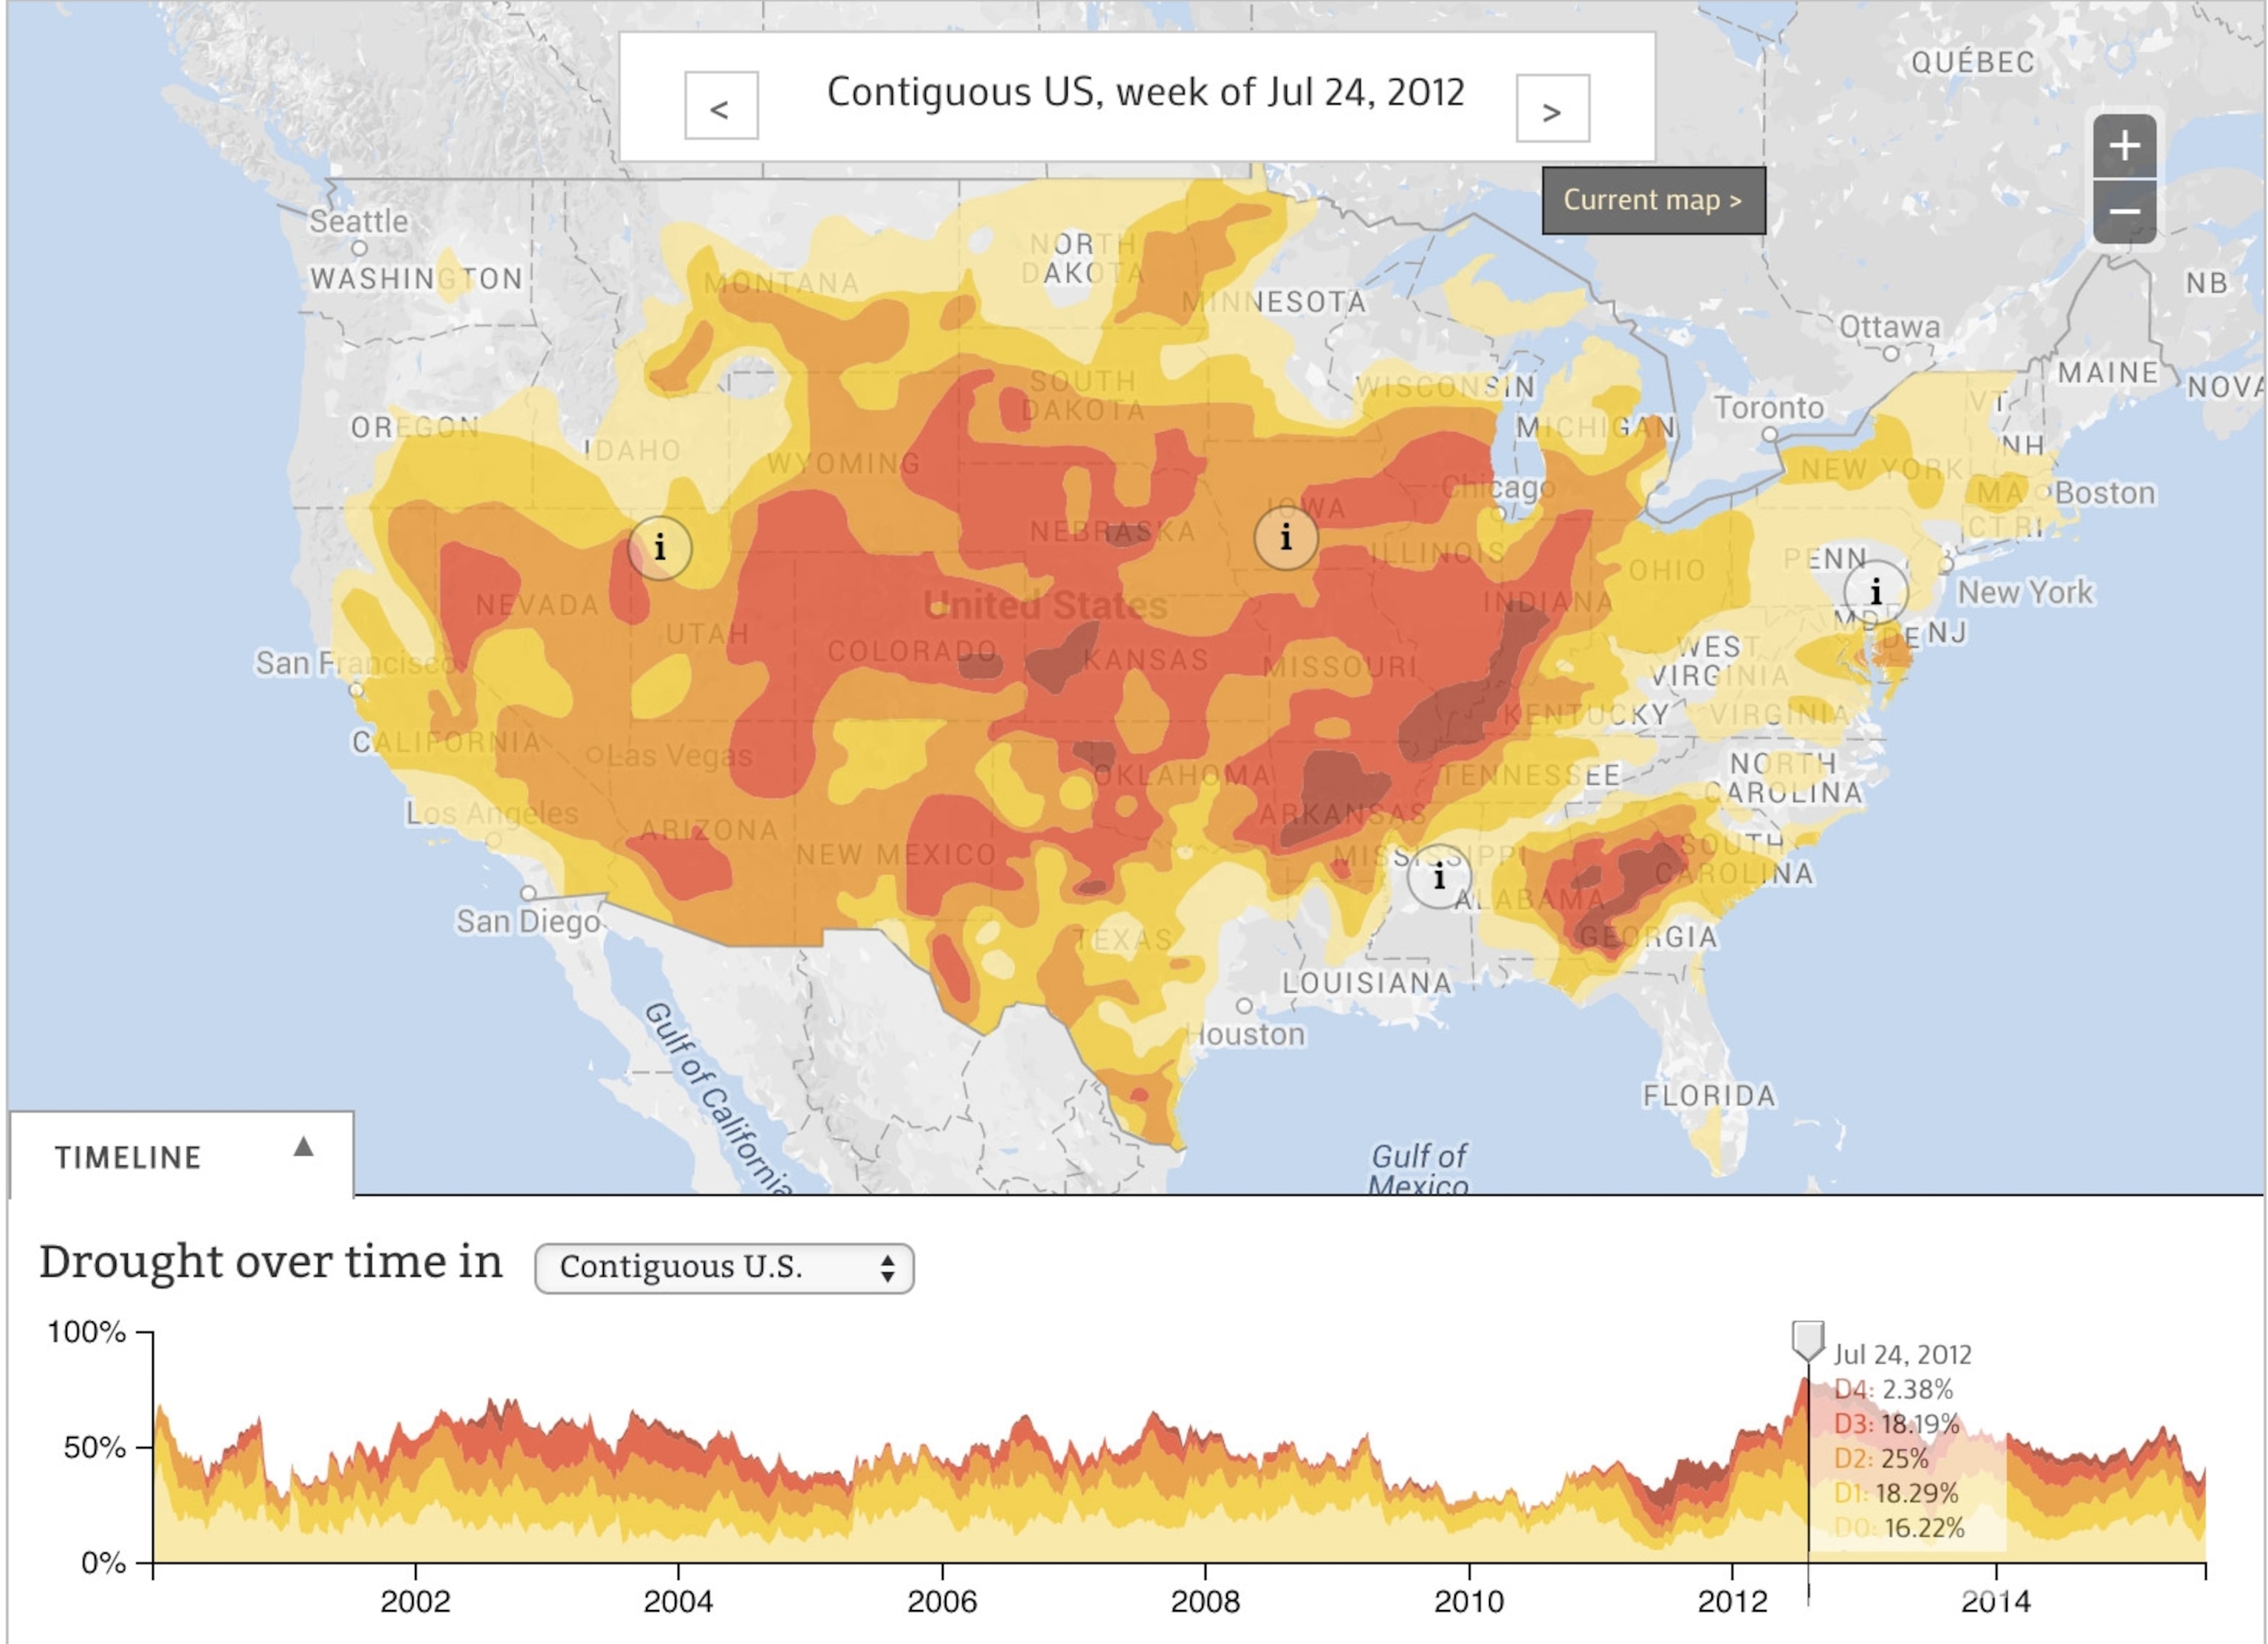
The Drought Monitor is one of the most widely used tools for following conditions in California and the rest of the country. Every week analysts at the National Oceanic and Atmospheric Administration (NOAA), the USDA, and the University of Nebraska-Lincoln compile measures such as temperature, rain, soil moisture, and vegetation health into an easy-to-follow digest.
Insights from the Drought Monitor
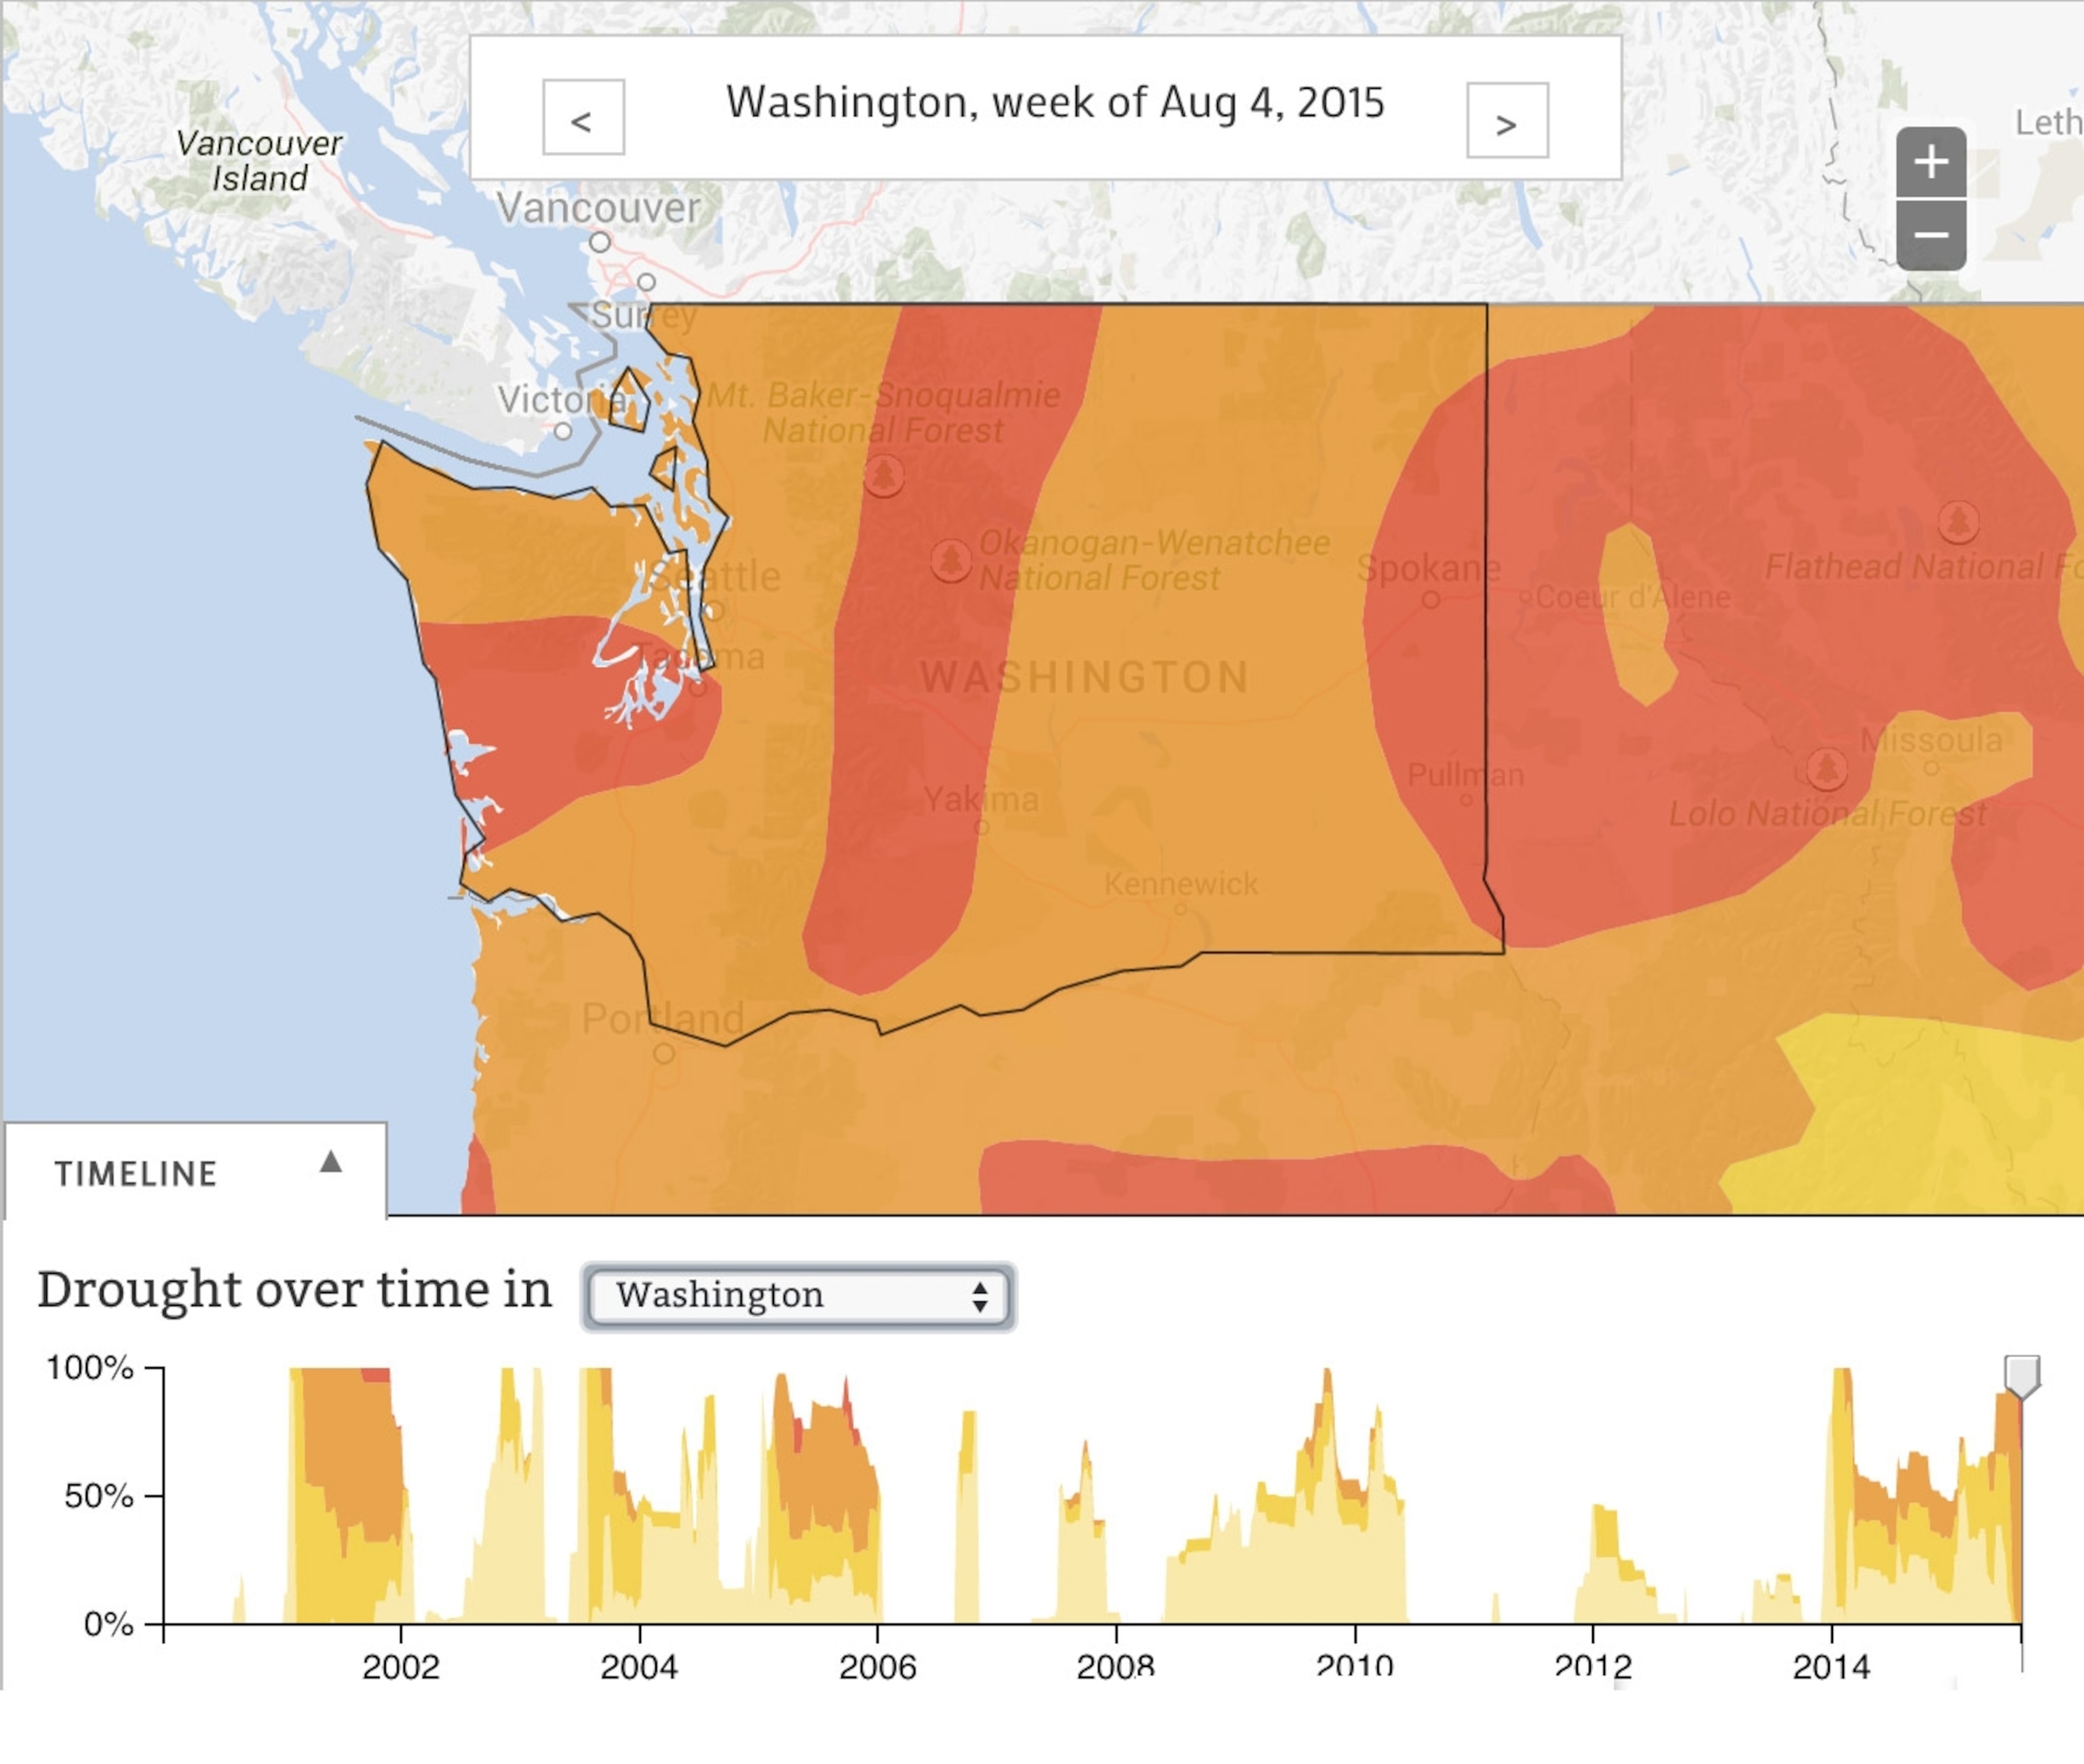
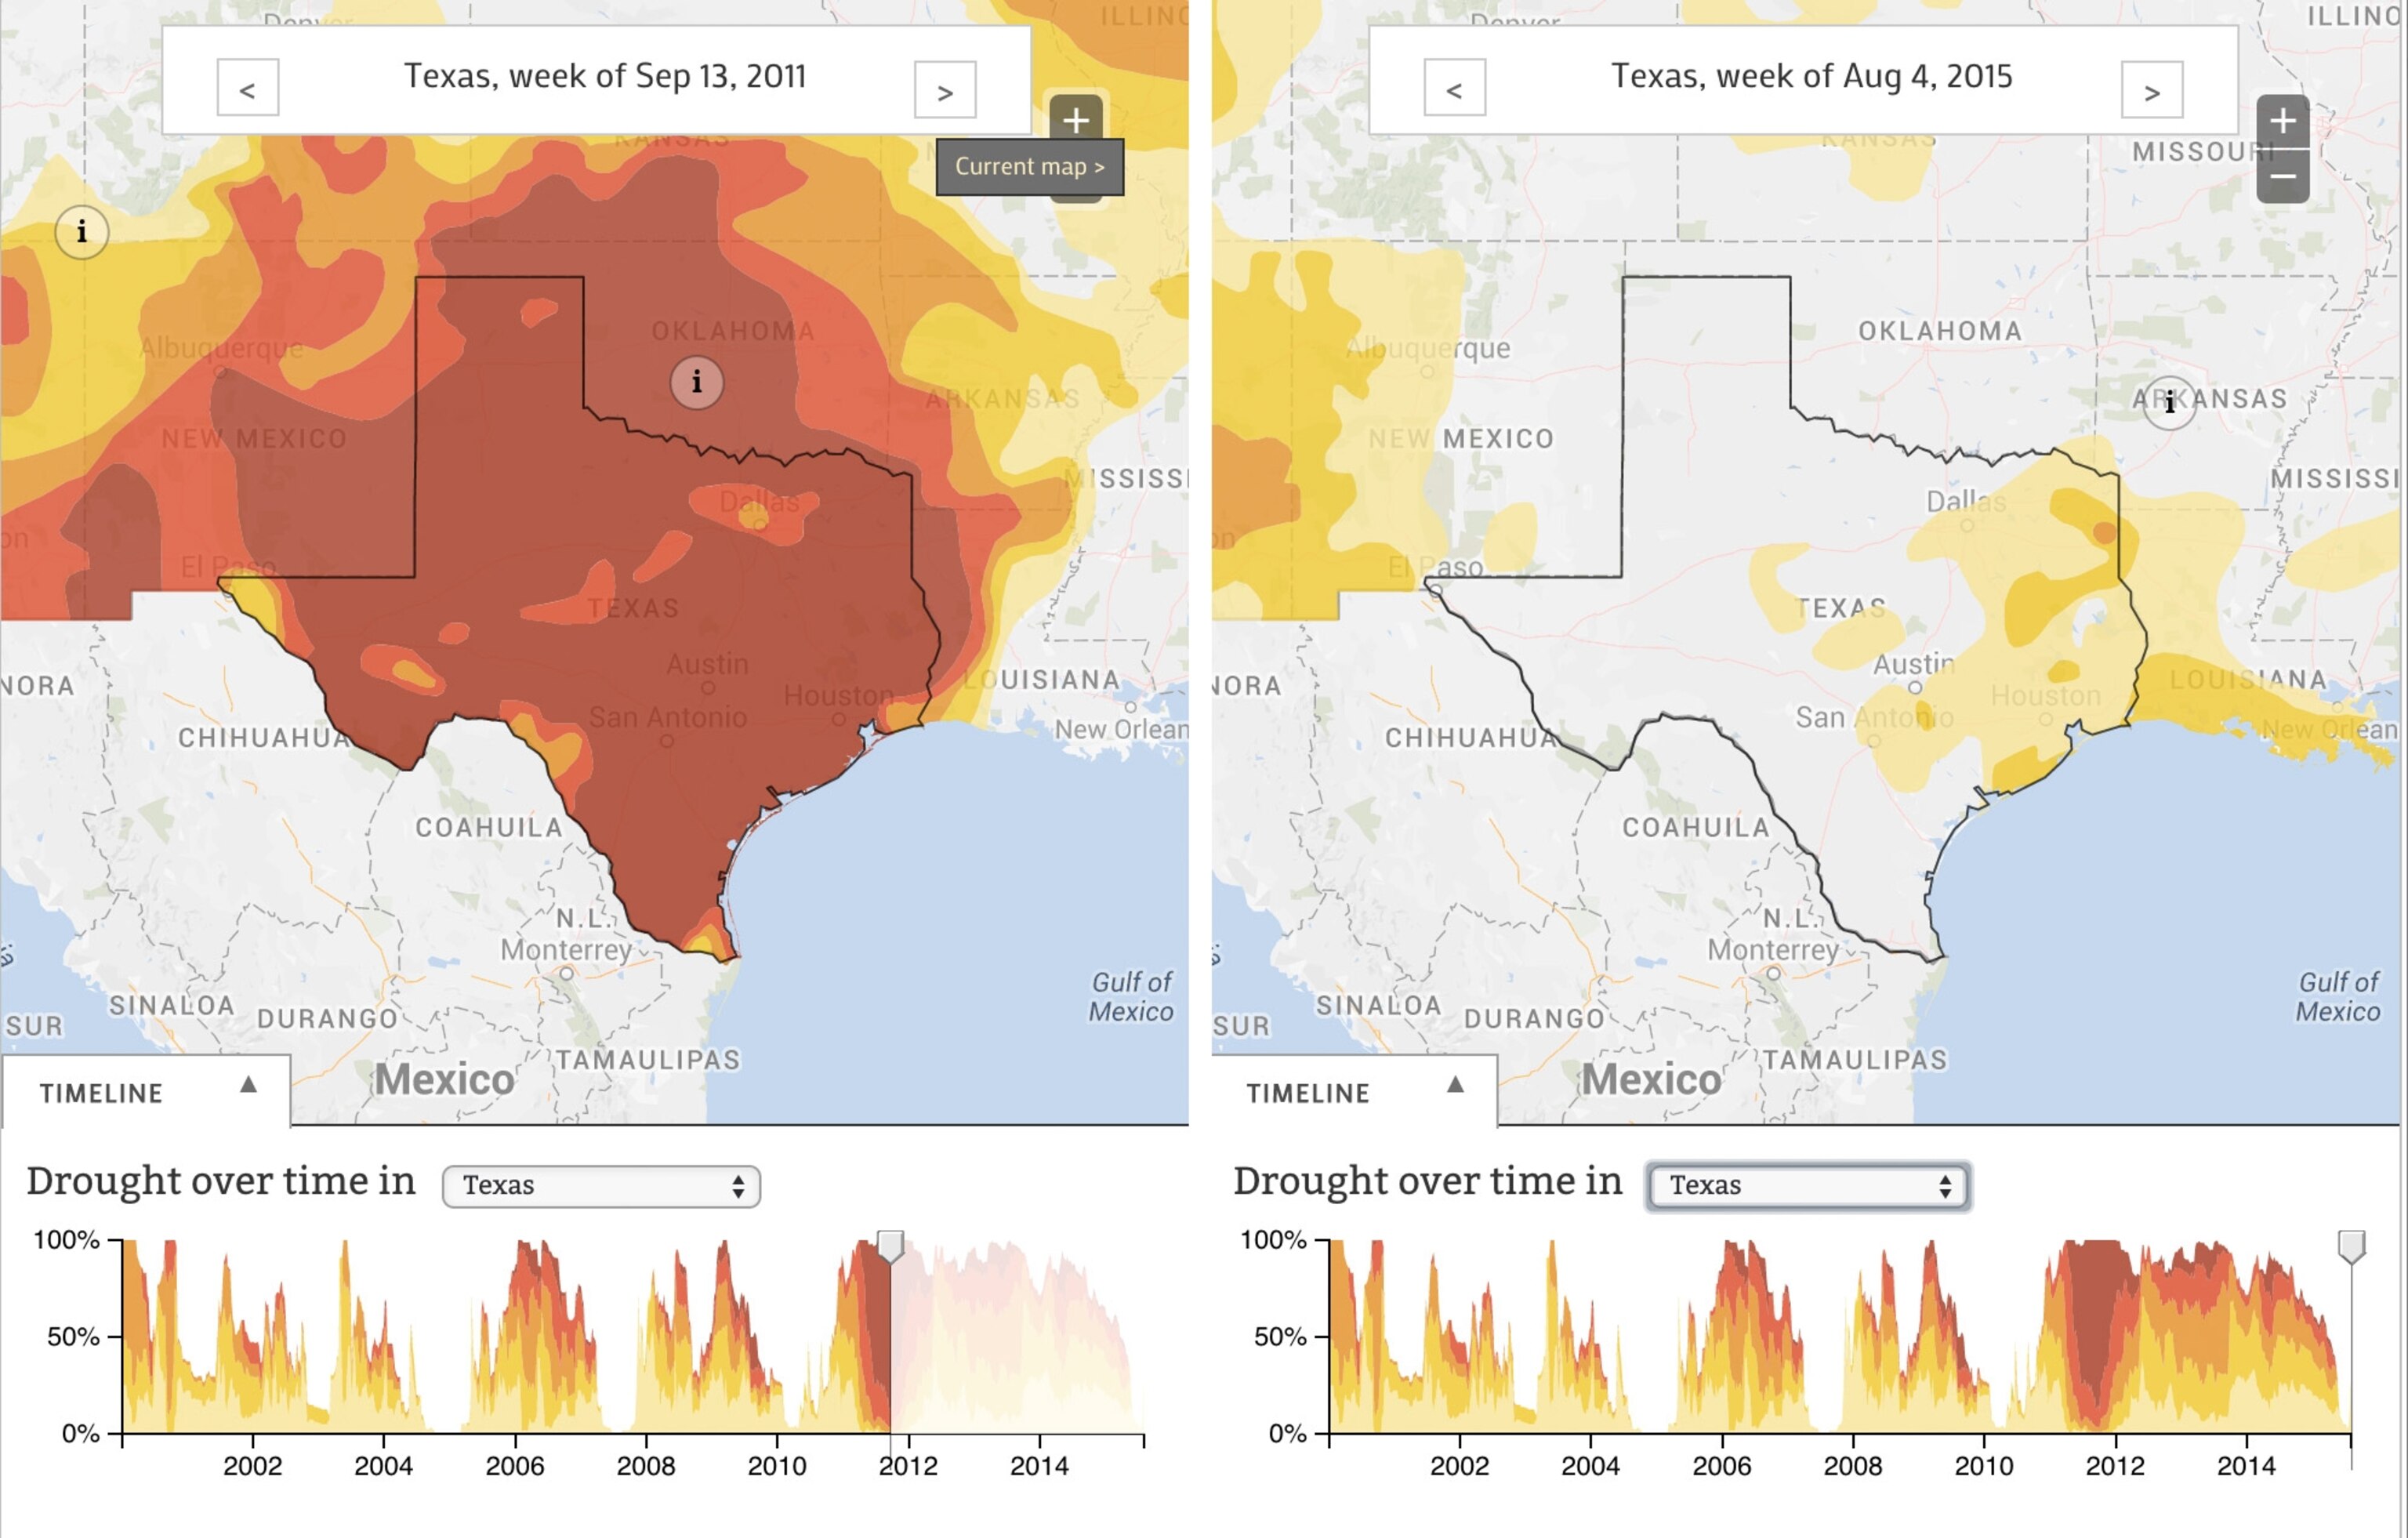
Our interactive map "Tracking U.S. Drought Severity" presents weekly Drought Monitor analyses for all 50 states, going back to January 2000. Users can look at the changing state of drought around the U.S., zoom in to see regional and state trends, and read narratives written by the analysts who compile the reports.
A Drought Here, A Torrent There
Last winter, as California and the West baked in the sun, the northeast set snowfall records. As Stanford University climate scientist Chris Field told Boston public media, "Basically, the storms that we should've had in California ended up whacking New England."
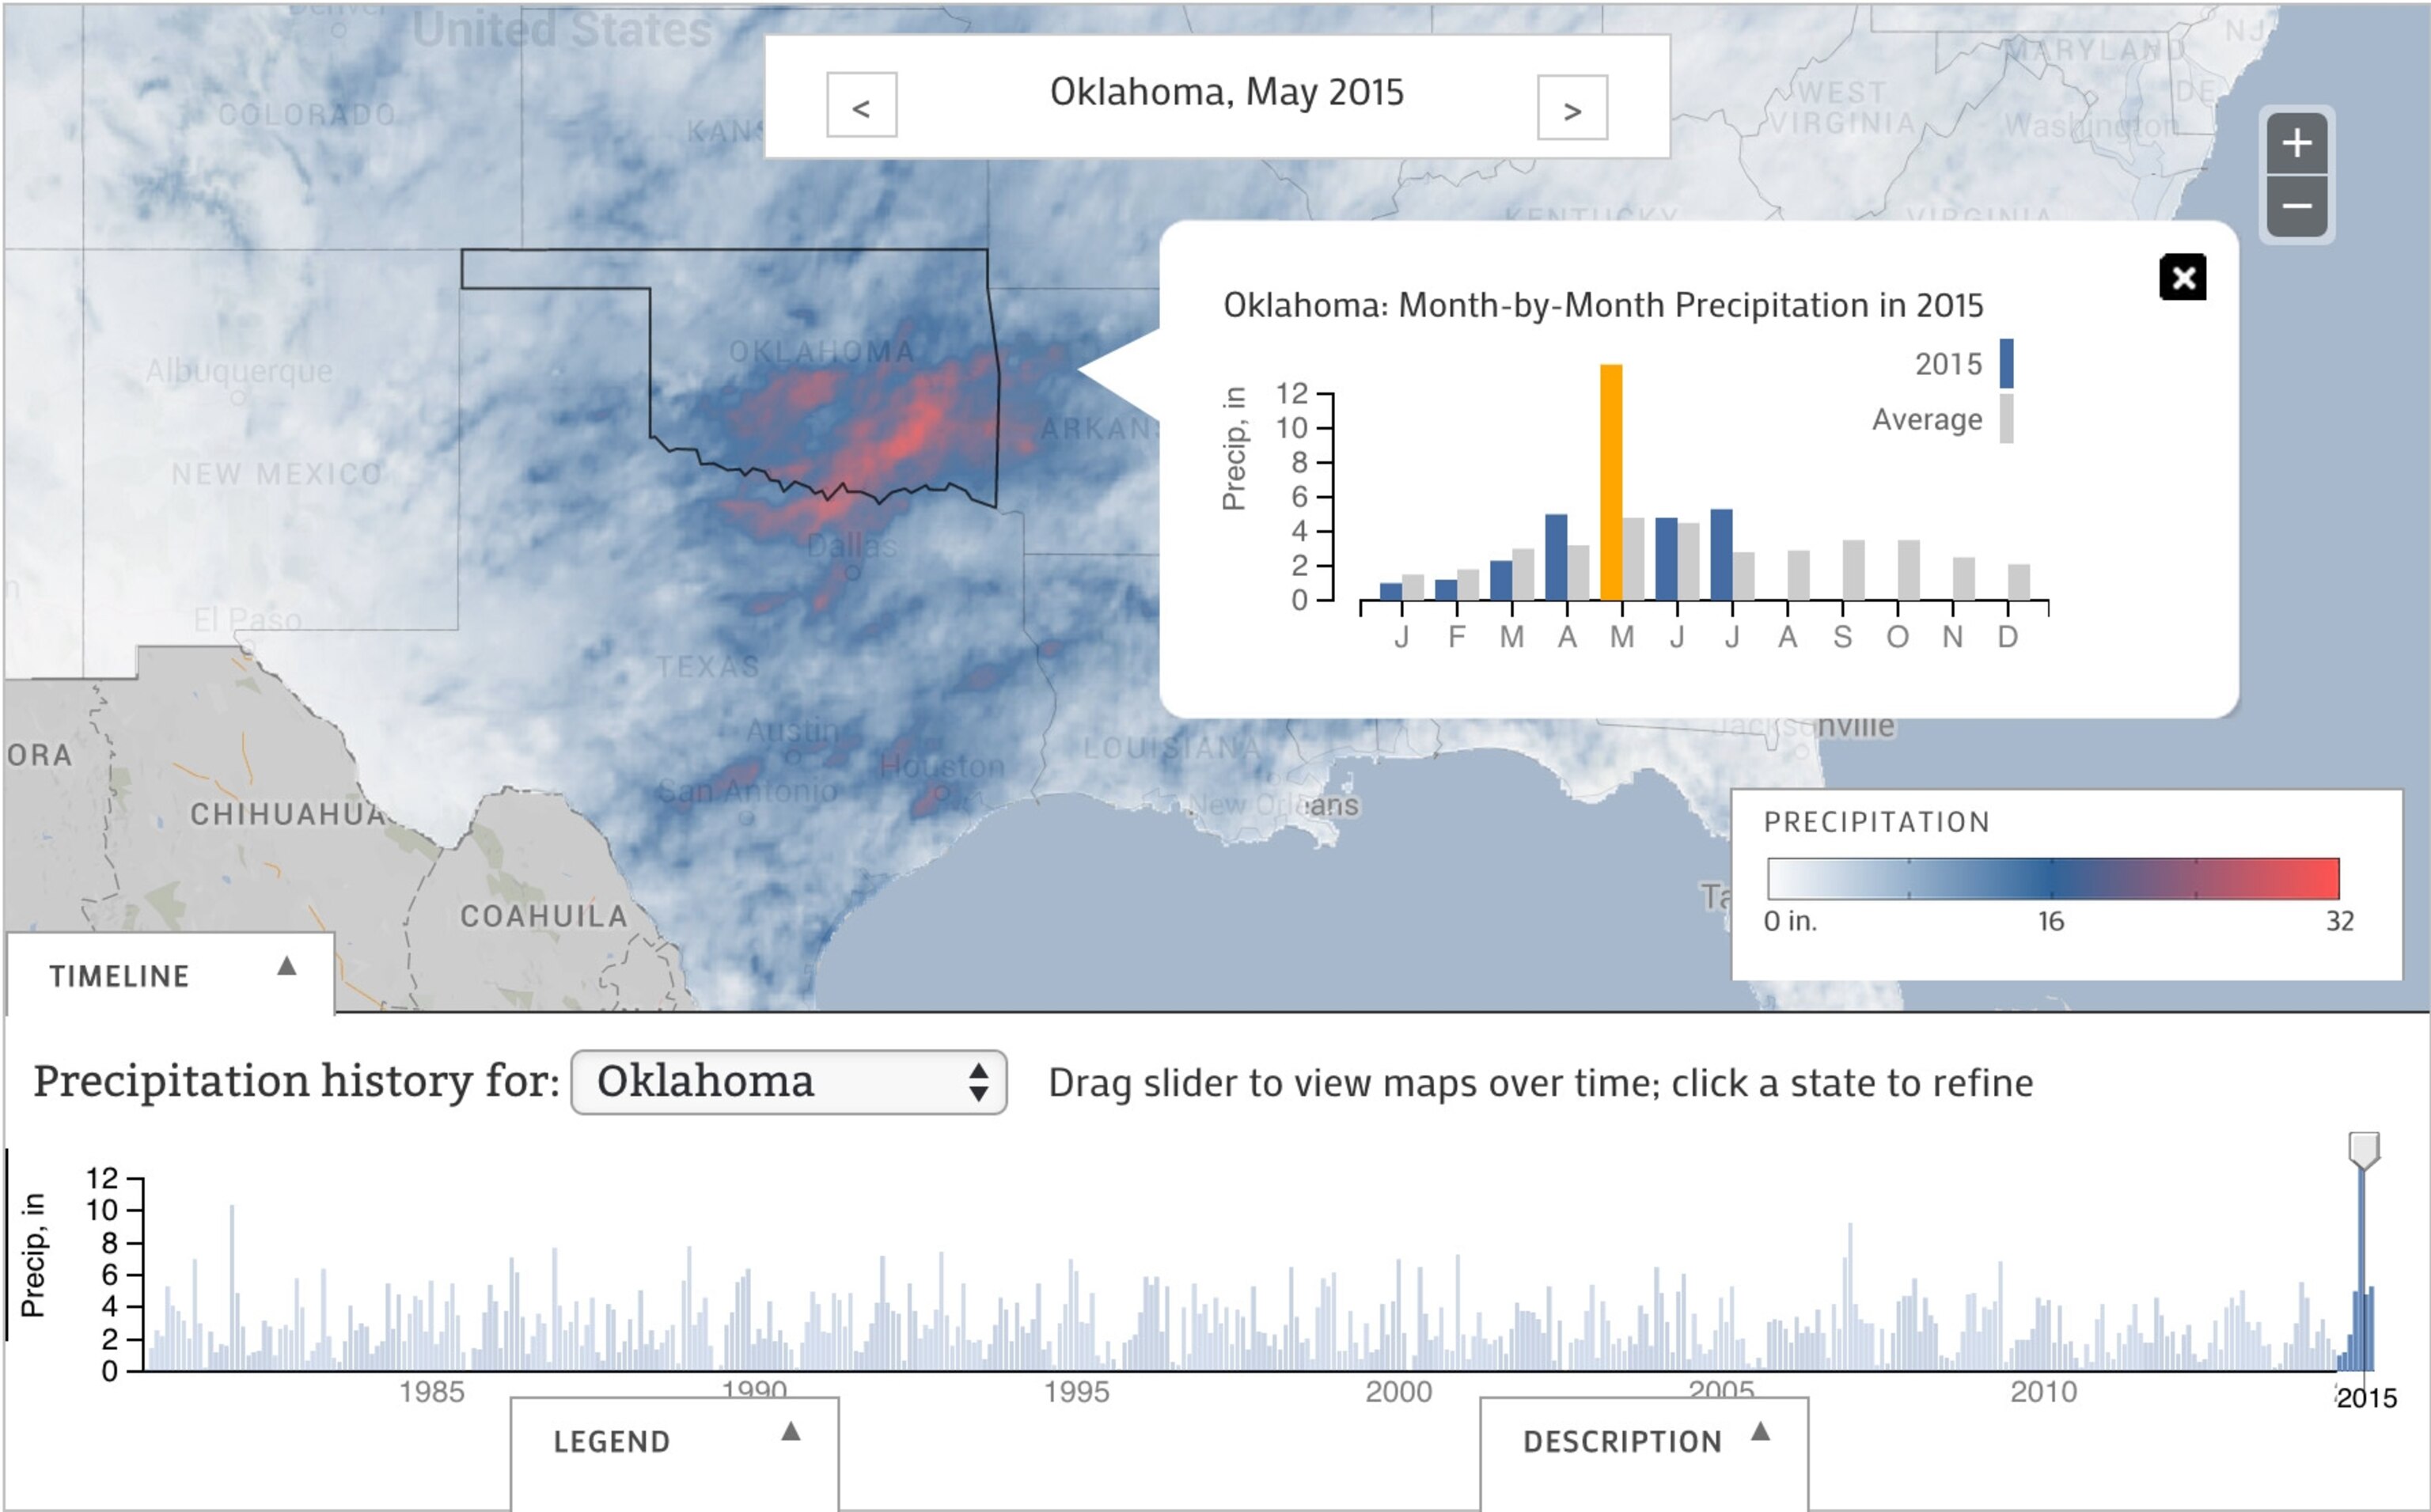
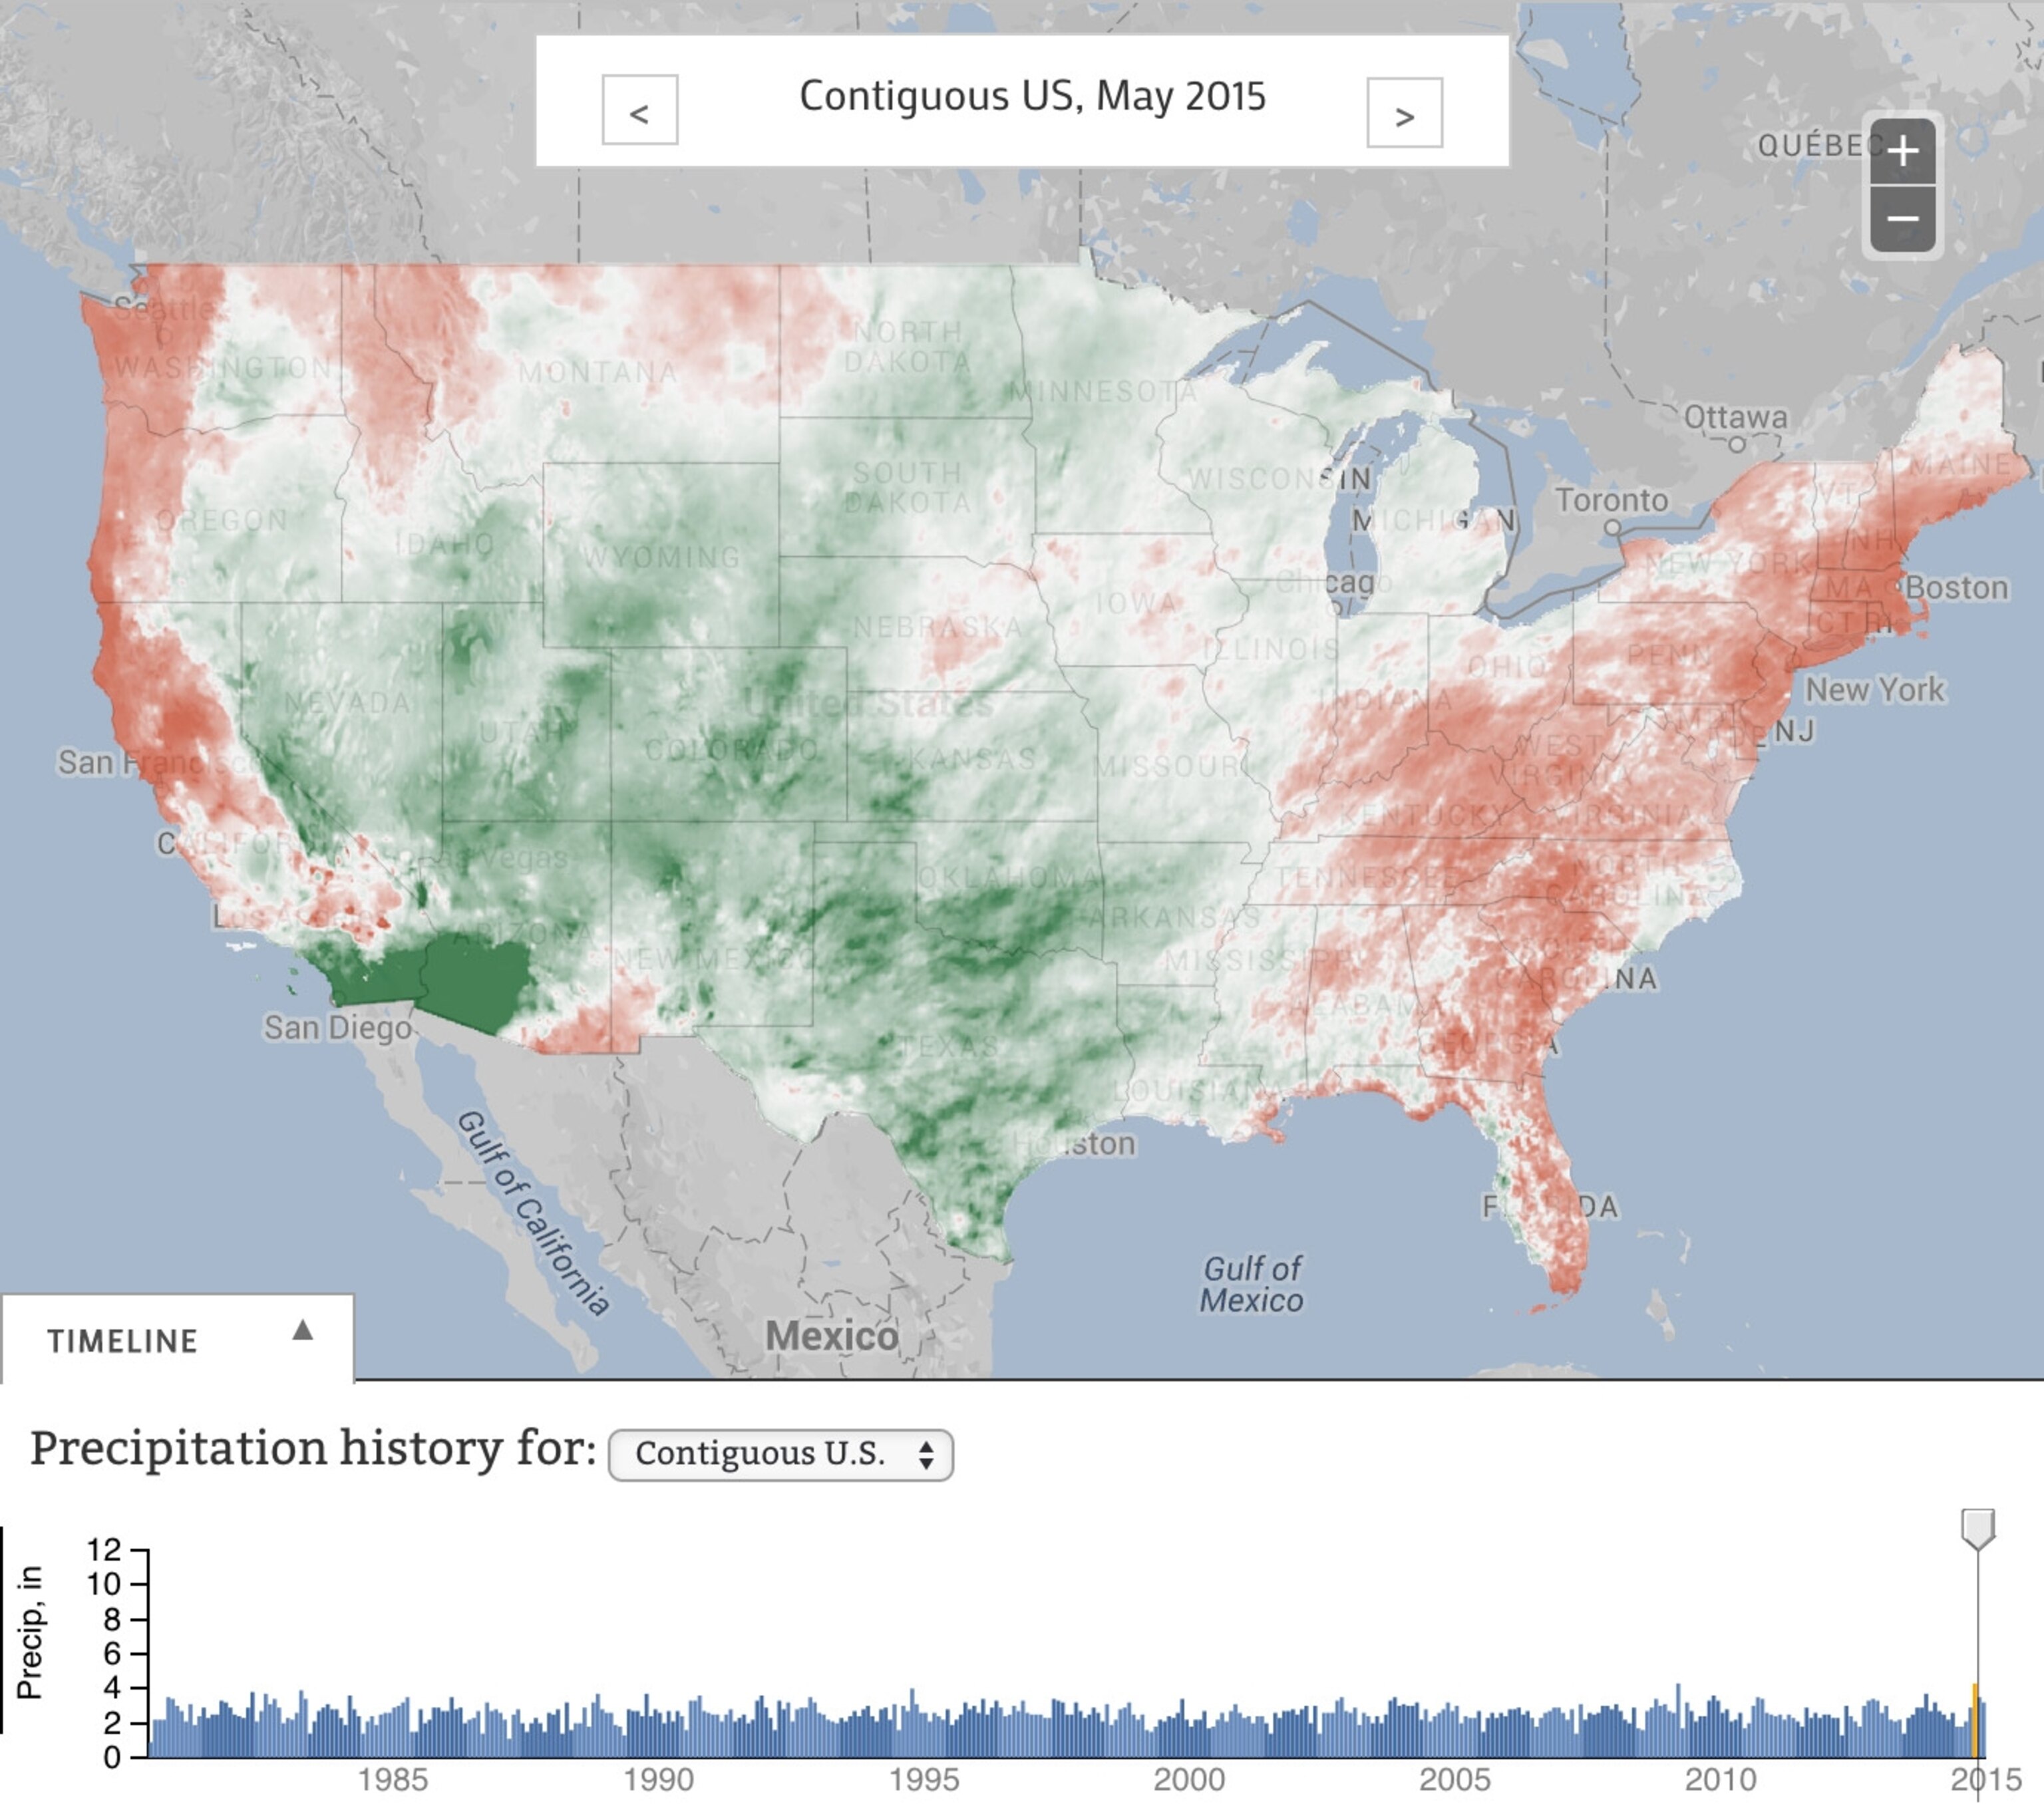
Indeed, Boston saw a record amount of snowfall over the winter of 2014-15, getting more than nine feet of snow (110.6 inches). Other parts of the U.S. have also broken precipitation records this year, including Colorado, Oklahoma, and Texas in May and Illinois in June. Overall, May was the wettest month ever recorded in the contiguous United States.
But the copious rains also show the dark side of what happens when the rains return. May's record rainfall, which NOAA said "essentially ended" the longstanding Texas and southern plains drought, also caused flash floods in Texas and Oklahoma that killed 40 people and did millions of dollars in damage.
A Look at Precipitation Trends
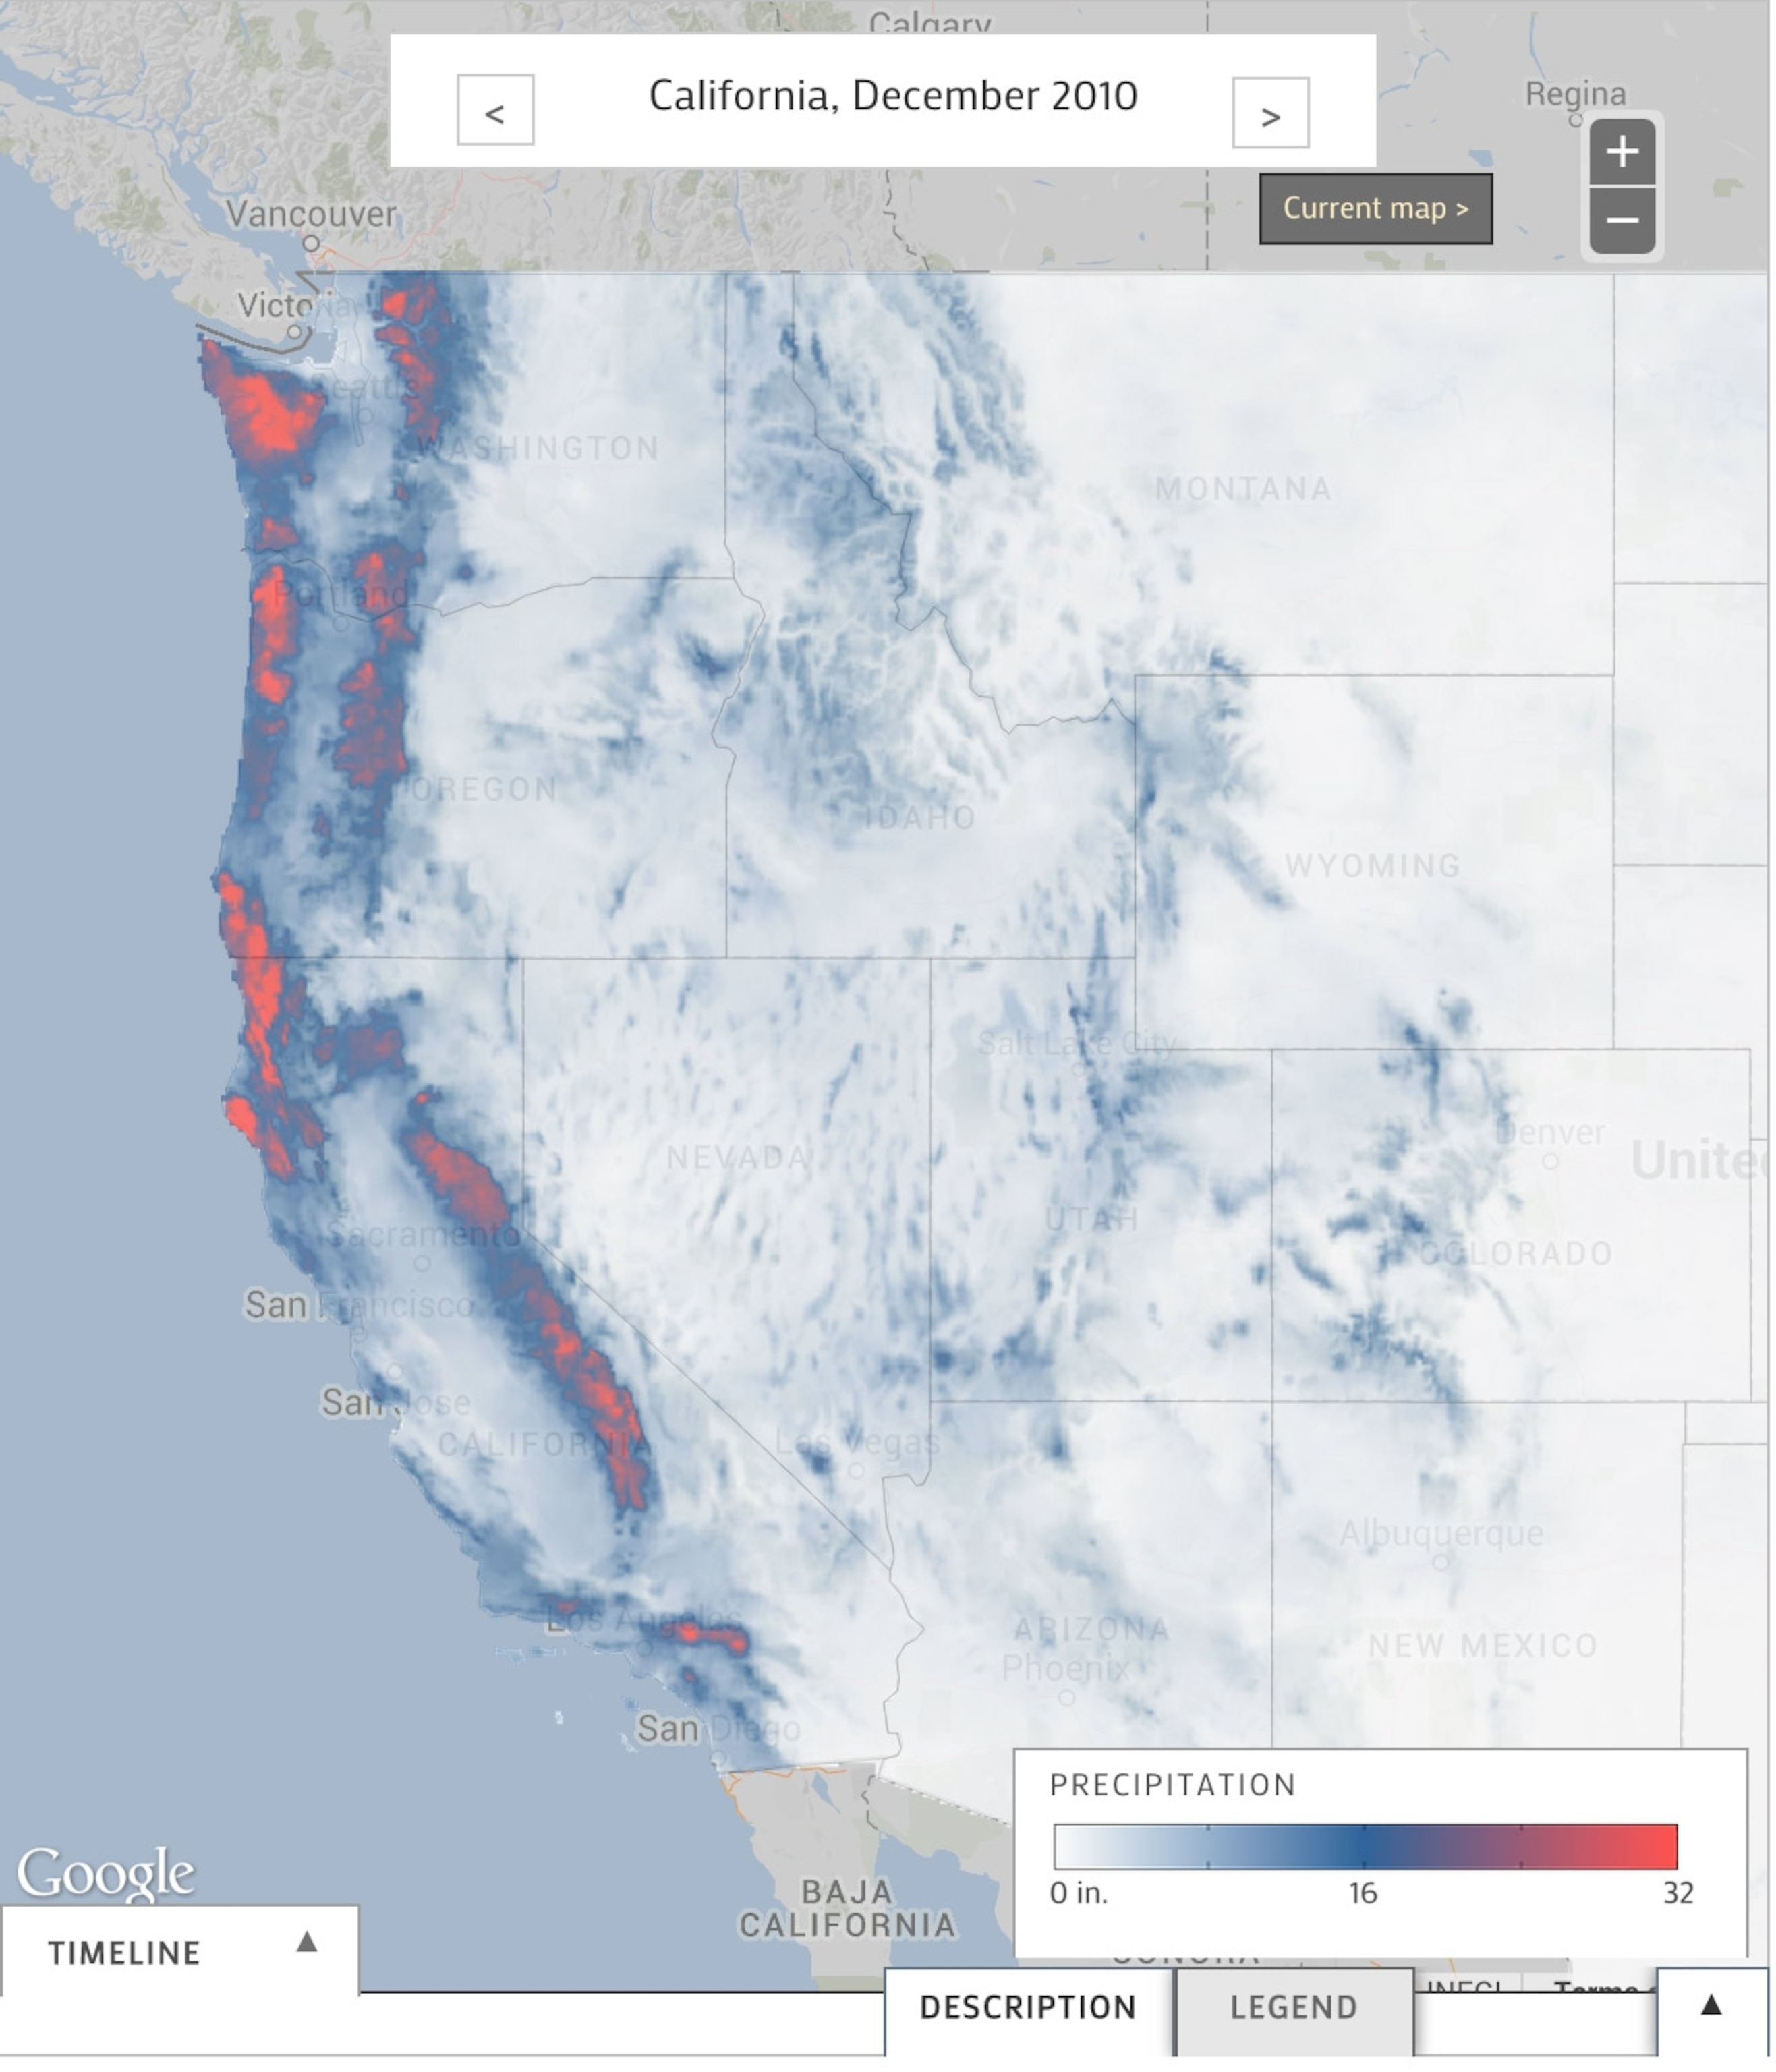
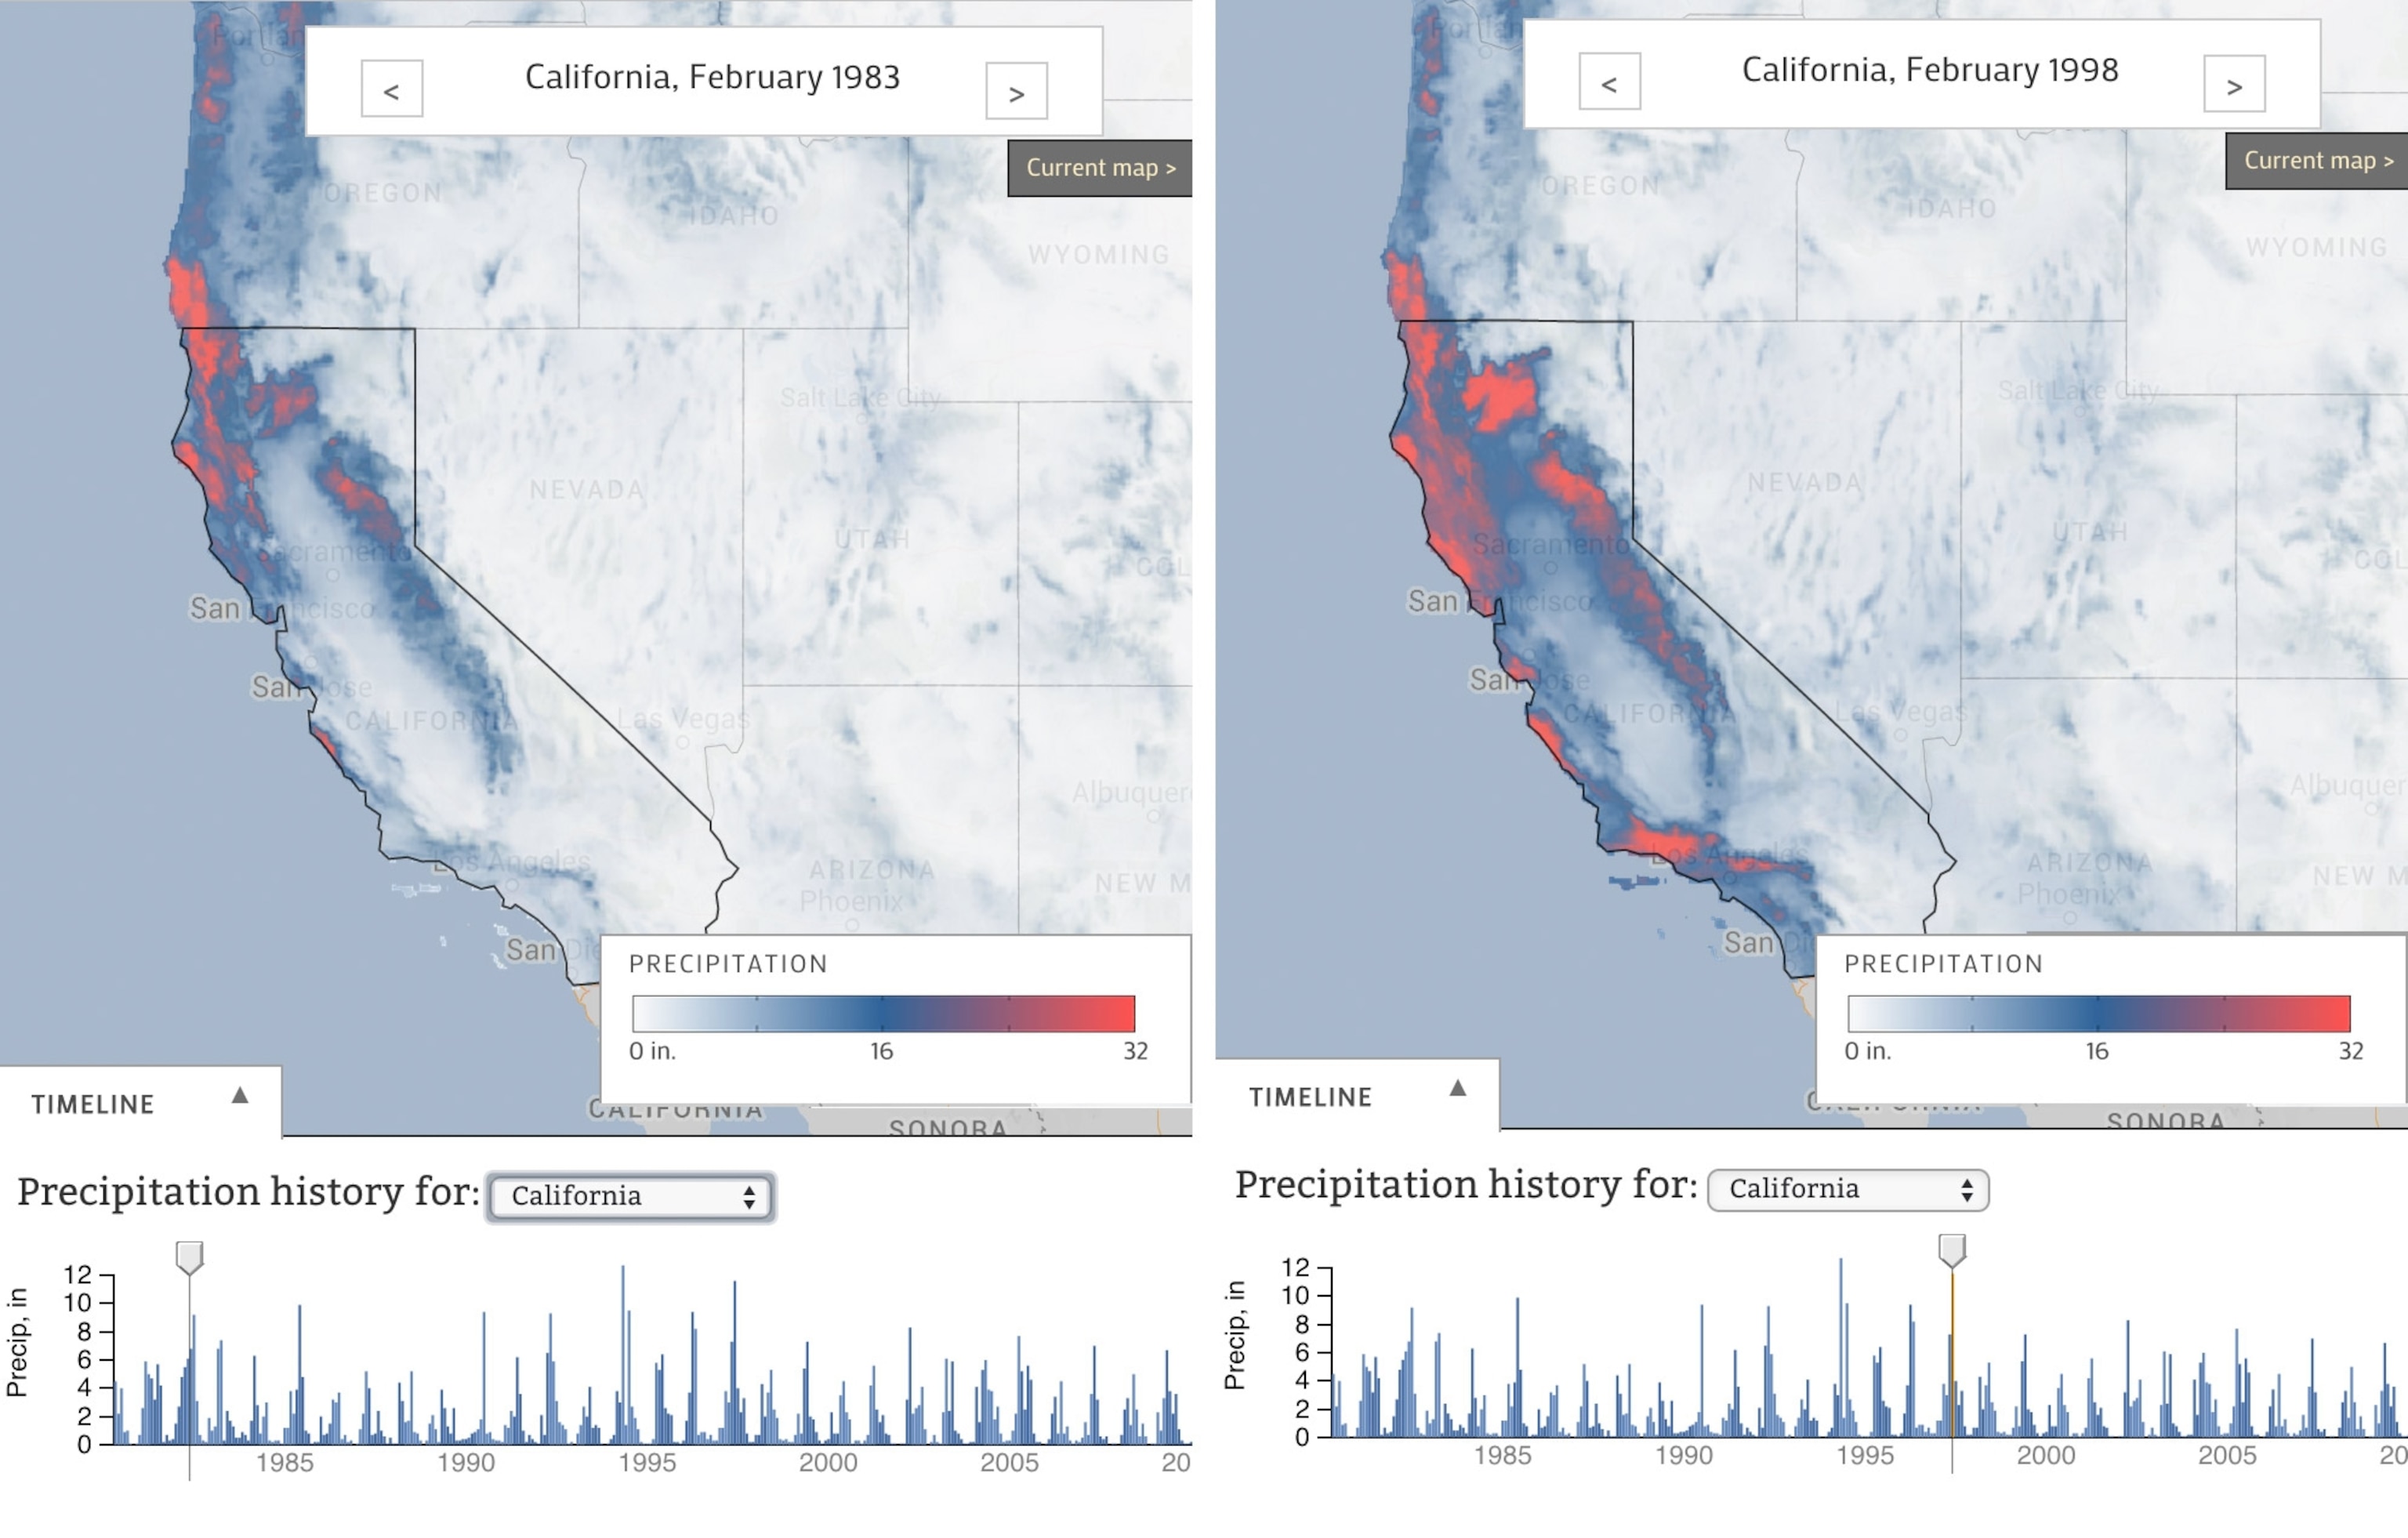
Another interactive graphic, Rain and Snow in the U.S. Since 1981, shows monthly rain totals for the contiguous U.S. Based on precipitation measurements and a model developed by the PRISM Climate Group at Oregon State University, the map shows rain and snow both in absolute terms and in comparison with the overall trend for the 30-year period of 1981-2010.
Looking Ahead: A Lot Riding on El Niño
Many westerners, particularly Californians, are hoping that El Niño will finally bring drought-ending rain. El Niño, a pattern of warmer than average temperatures in the equatorial Pacific that often brings wet winters to parts of the American West, could indeed spell relief. El Niños vary greatly in strength, but climate scientists report that the current one is looking strong.
Like the heavy spring rains in Texas, a strong El Niño could relieve drought conditions— though perhaps at a significant cost. Two of the strongest El Niños of recent decades contributed to major flooding in the winters of 1982-83 and 1997-98. A weaker El Niño fed California's most recent wet winter, in 2010-11.
Moreover, it's unlikely that one wet winter alone would be able to end the West's water deficit, especially given that years of intense pumping have seriously shrunk groundwater reserves.
Whatever transpires, we hope that these continually updated maps (and other forthcoming maps tracking snowpack, dams and reservoir conditions, and wildfires) will prove useful to anyone interested in the continent's vitals. For more information, visit vis.ecowest.org or email us at comments@vis.ecowest.org.
Follow Geoff McGhee on Twitter.
