Sketching with Data Opens the Mind’s Eye
When does drawing become design? When does design become a story?
Data Points is a new series where we explore the world of data visualization, information graphics, and cartography.
The first storyboards for Close Encounters of the Third Kind were drawn by Steven Spielberg, who used stick figures. Artist Edward Carlson penciled his vision for Seattle’s Space Needle on a napkin in a coffee house. The inventors of Super Mario Brothers designed their video game, square by square, on graph paper.
Complex ideas begin as simple drawings. And data-visualization—the use of visual tools to analyze and present information— is no exception. Readers often imagine the creators of infographics as master programmers and number crunchers. But, many times, their primary design tools are pen and paper.
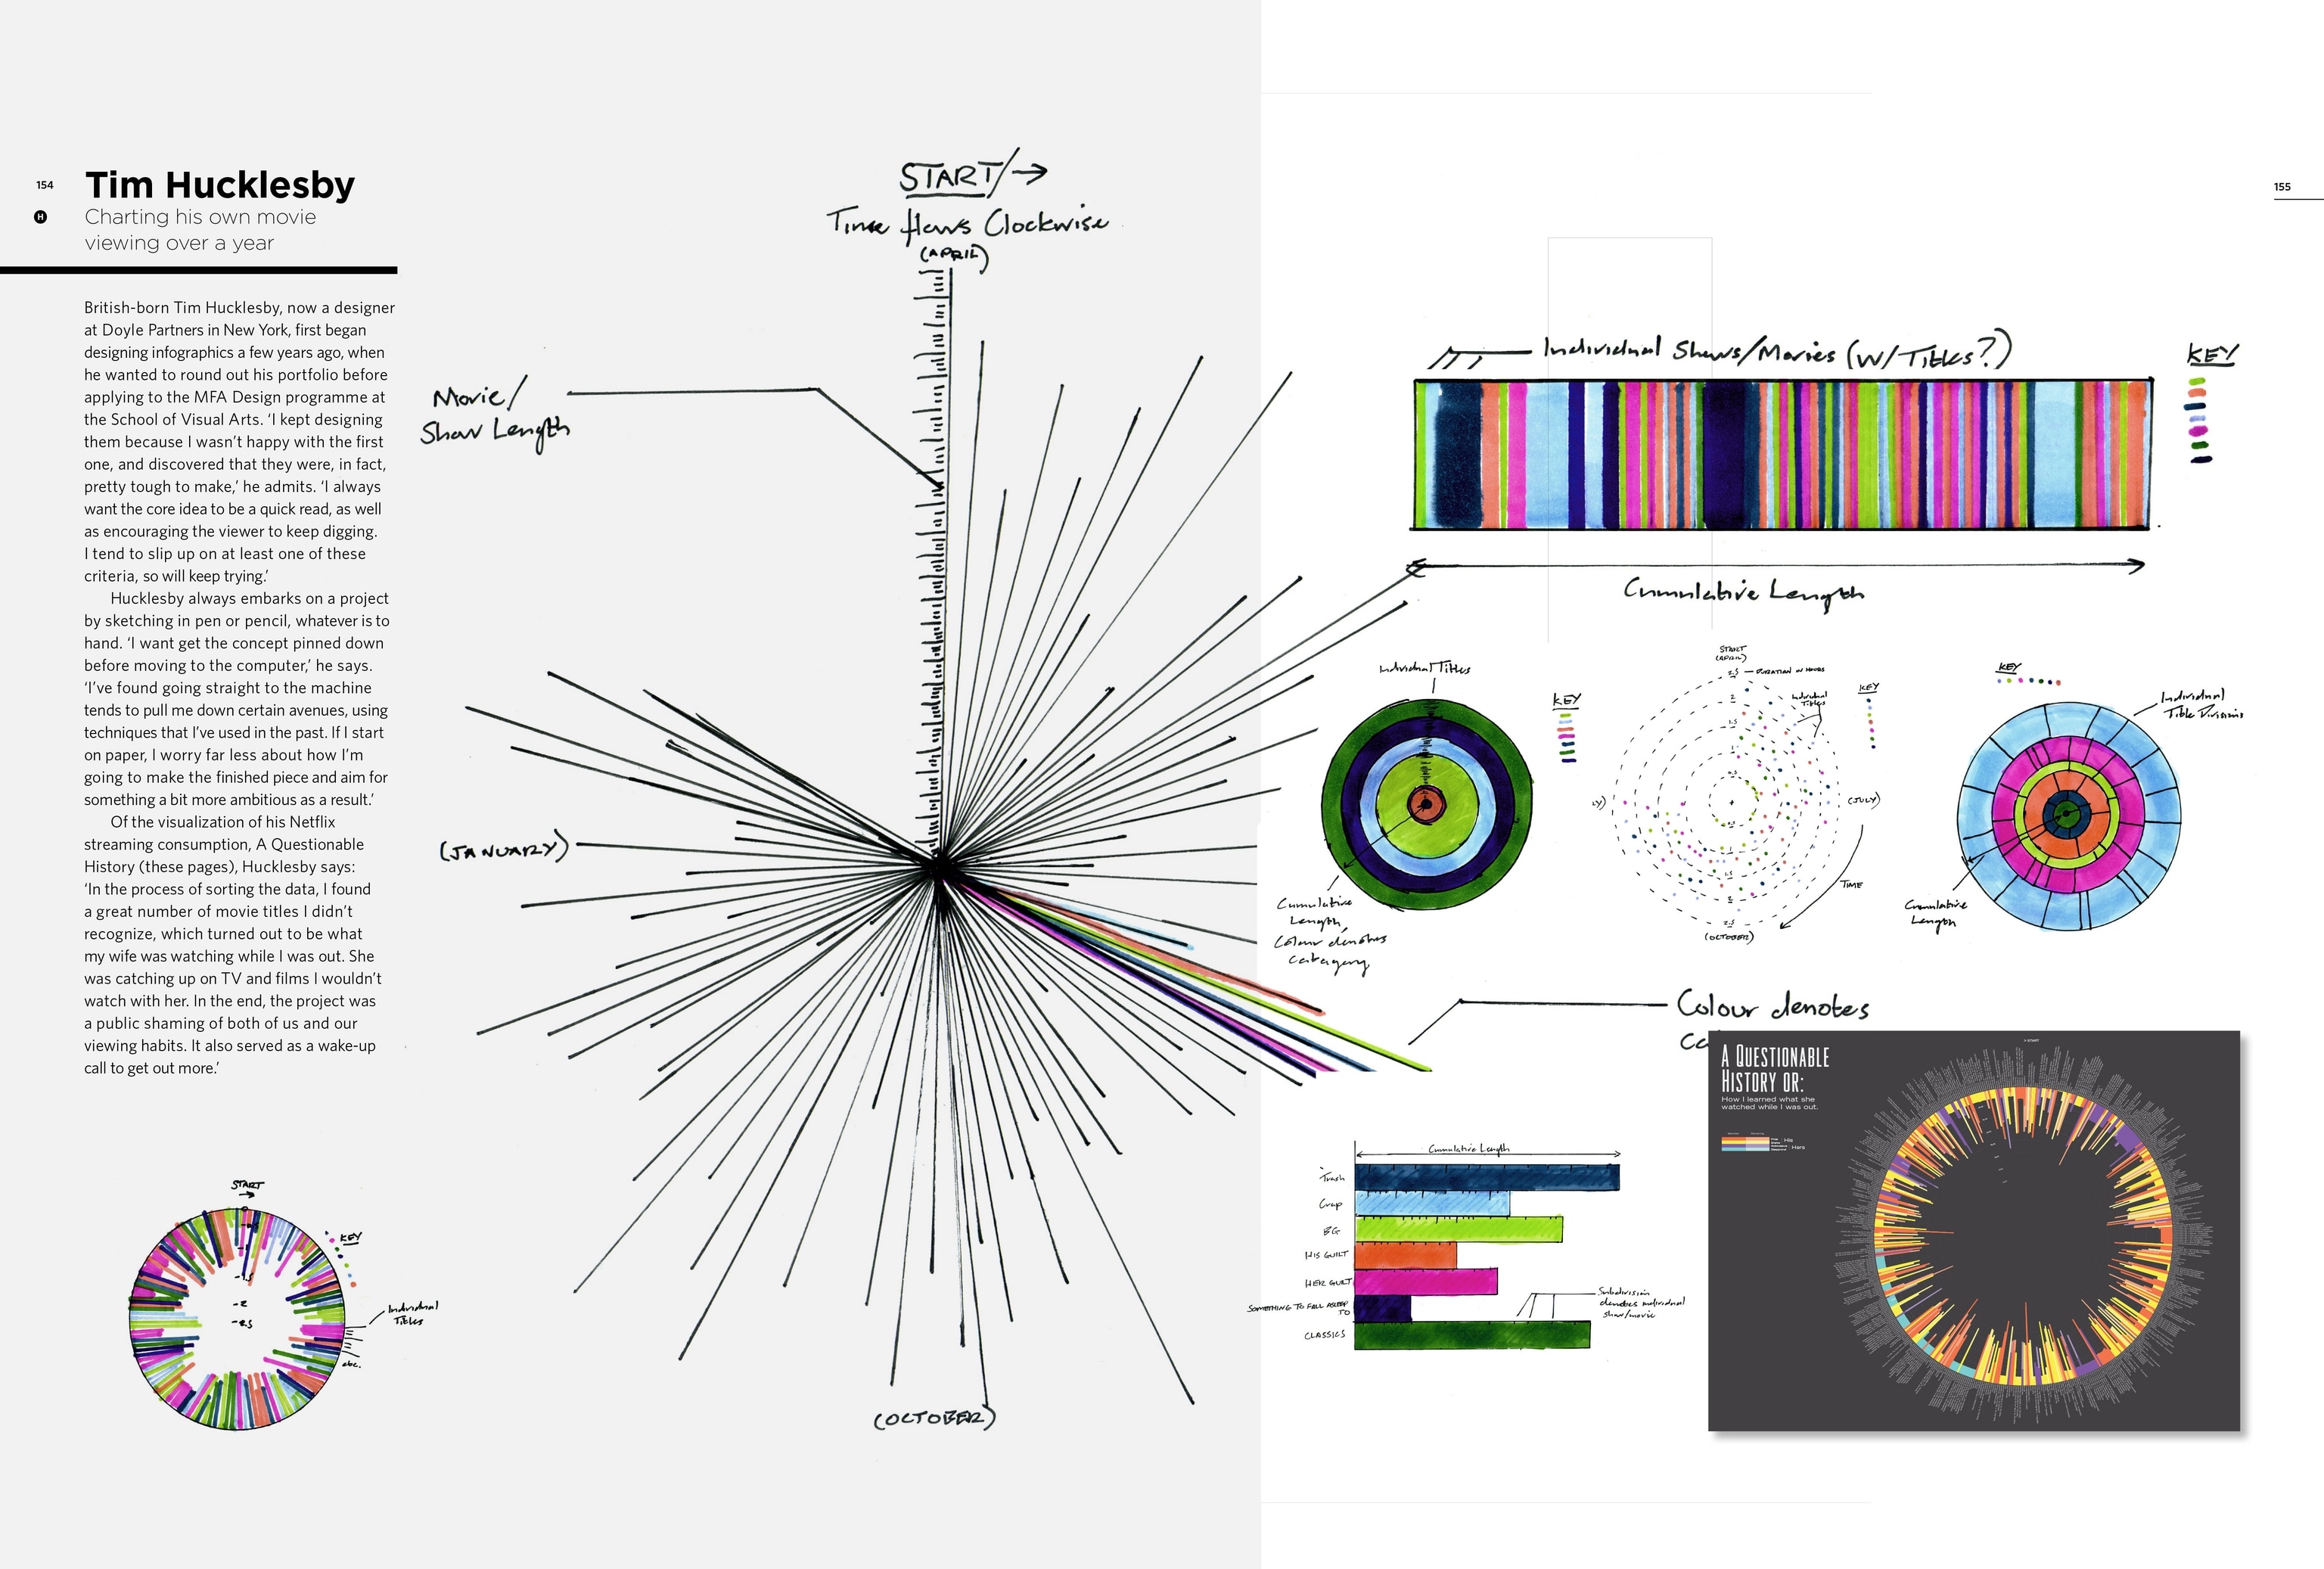
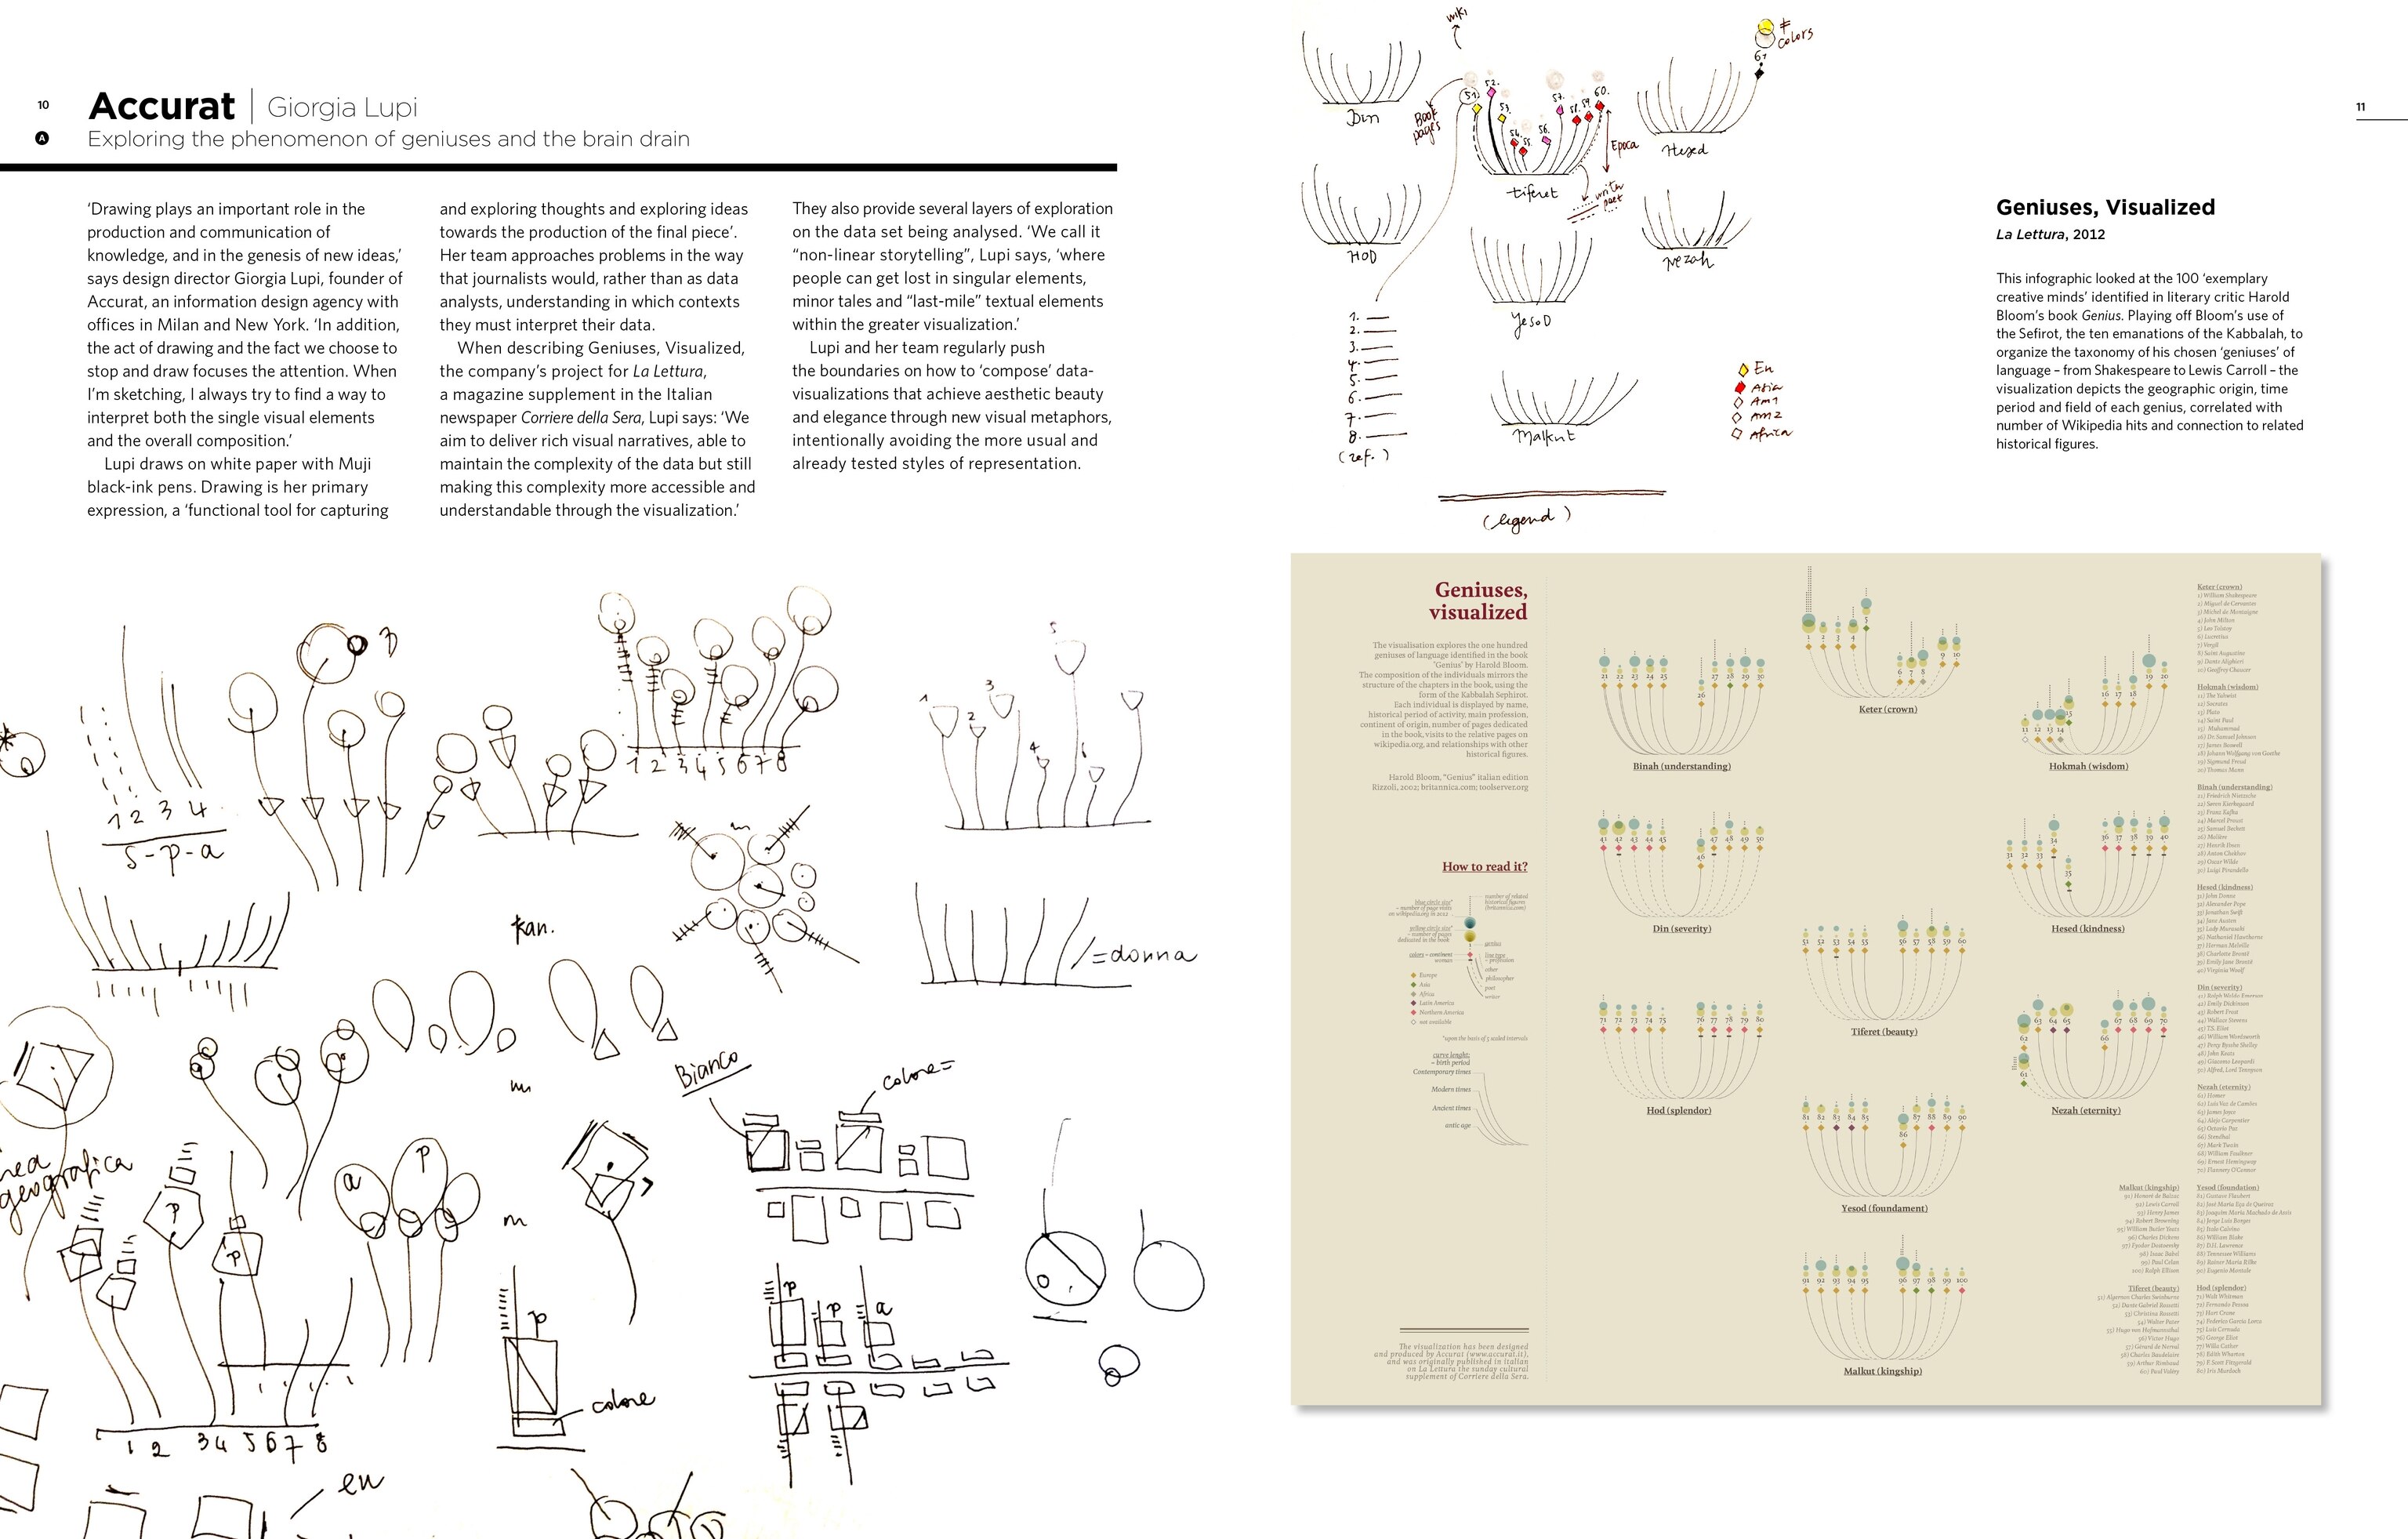
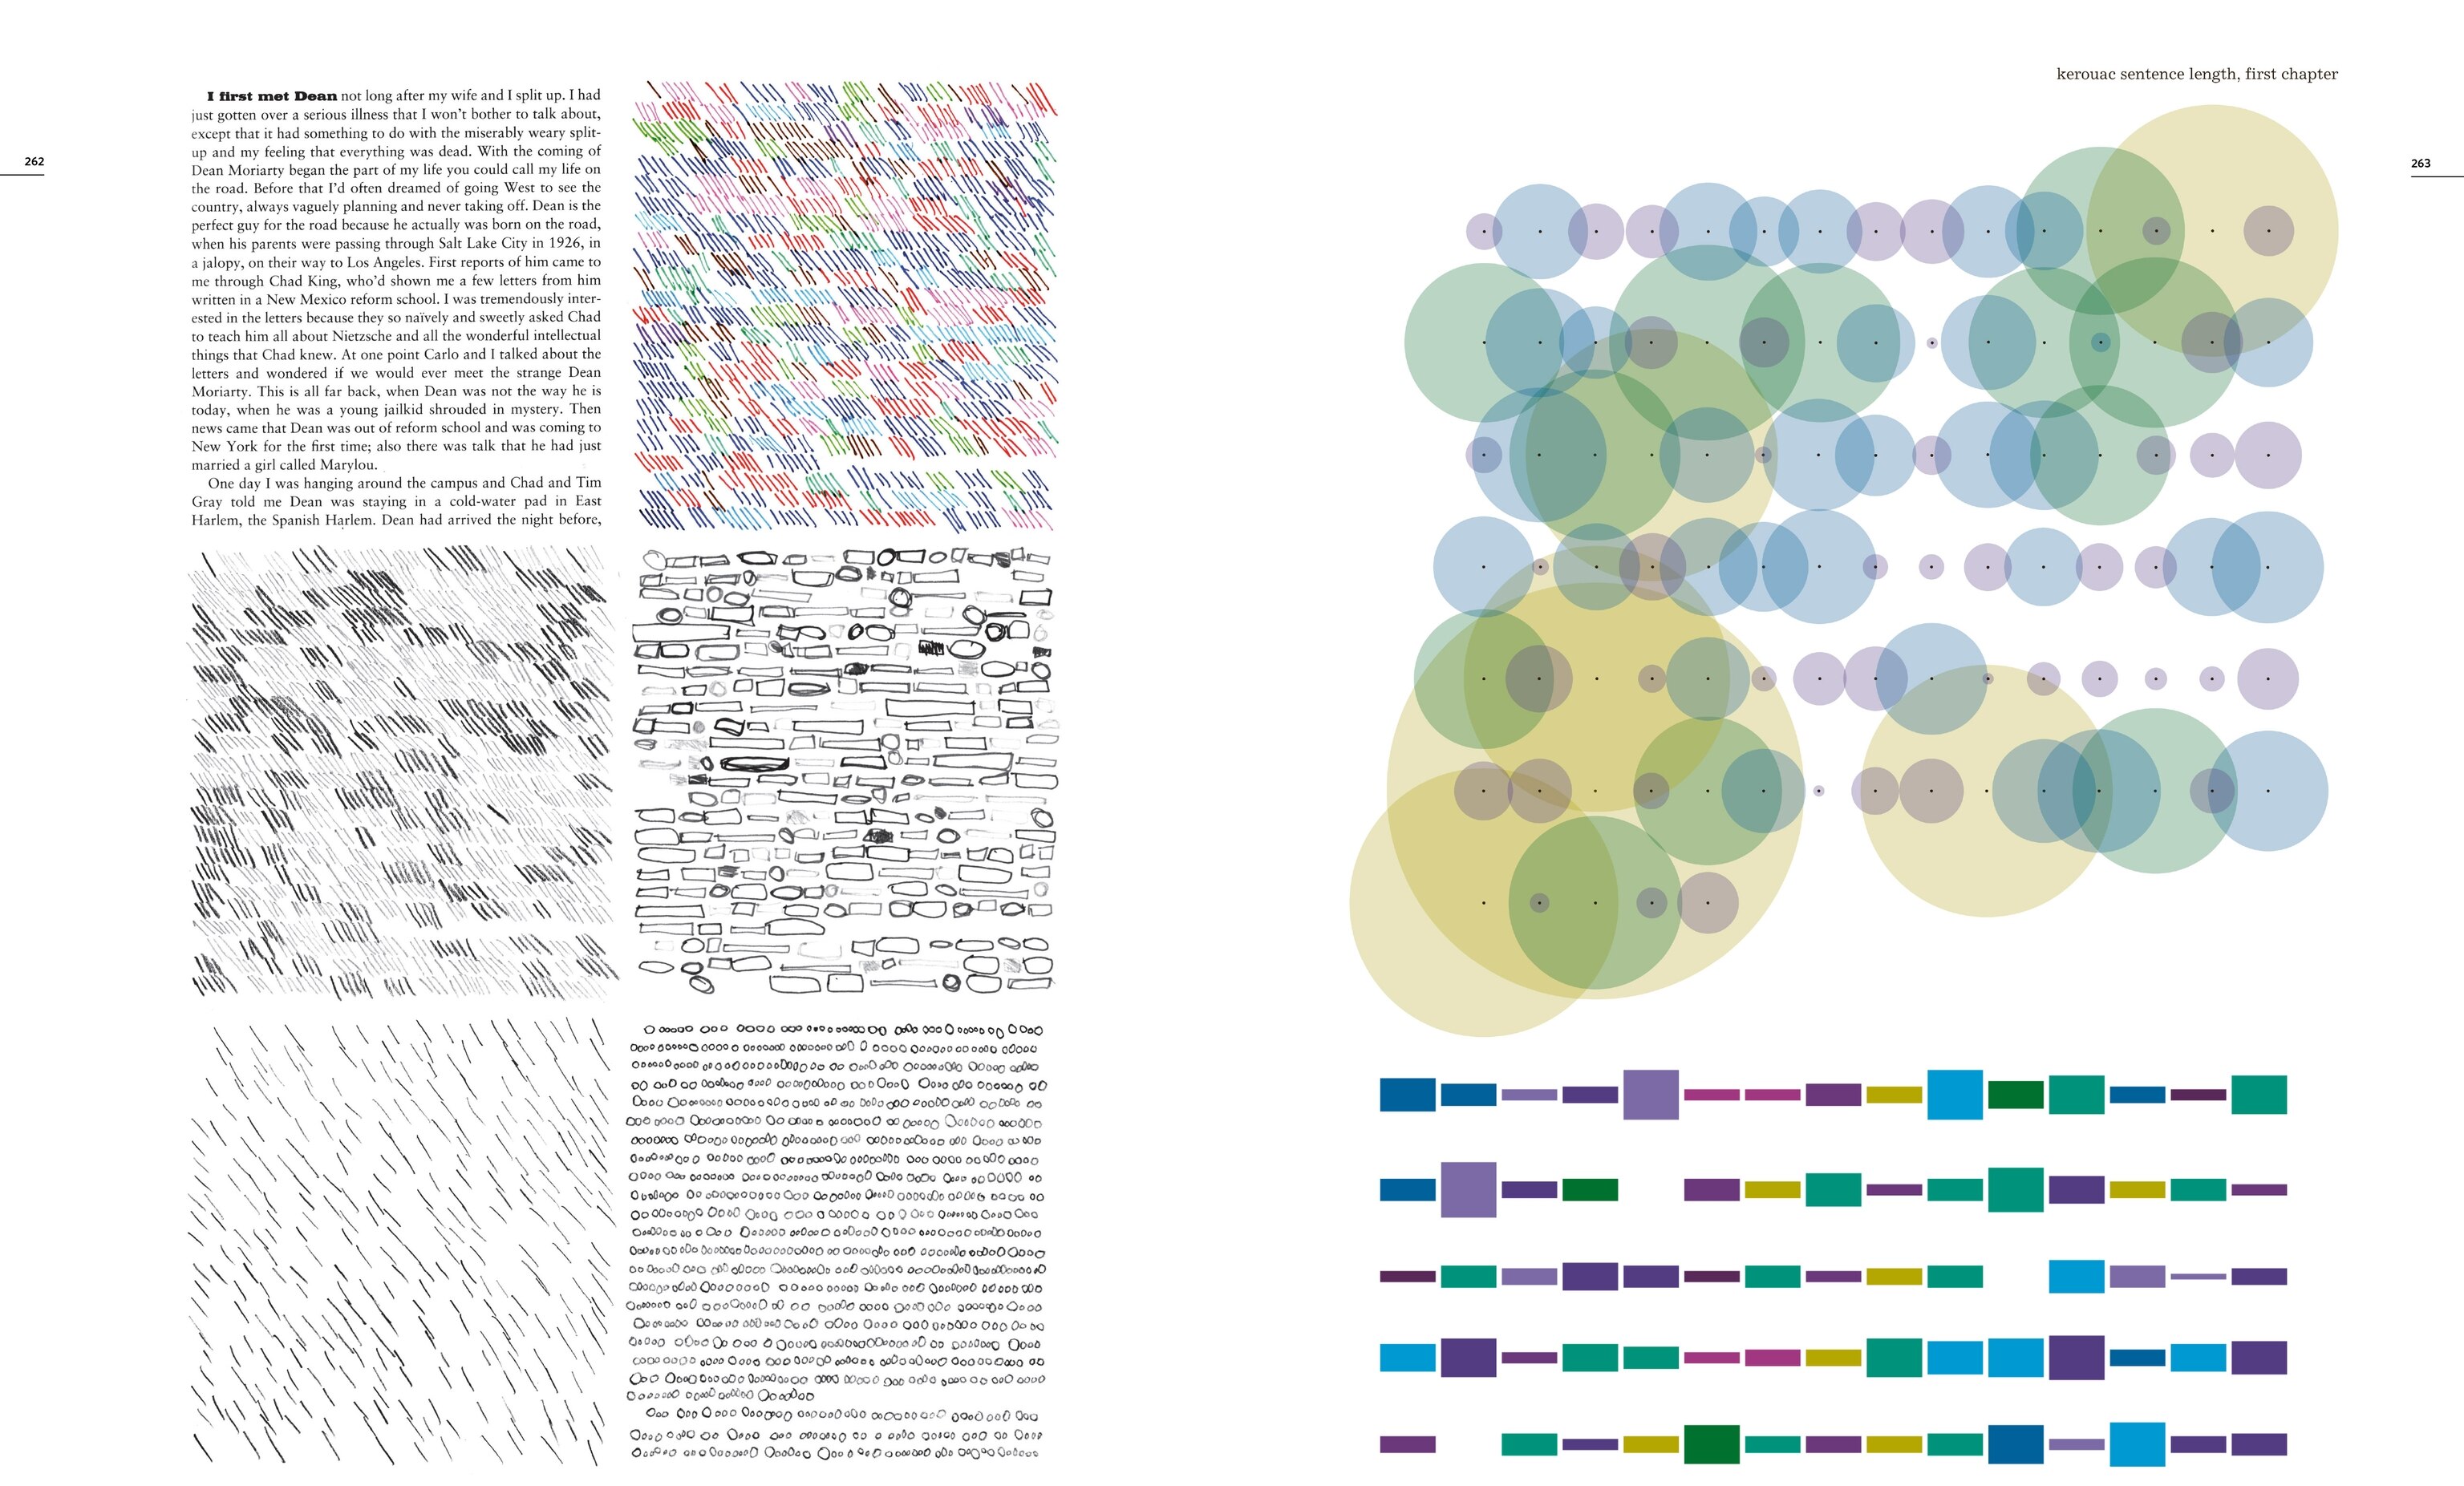
This creative process is laid bare in the Infographic Designers’ Sketchbooks, a fascinating collection of preliminary drawings, unfinished mock-ups and intermediate prototypes that culminate with the finished illustrations.
“The art of information display is every bit as artful as any other type of design or illustration,” write the book’s authors, Steven Heller and Rick Landers. And, they add, infographic designers must take their work a step further, sculpting static images into complex, yet reader-friendly, linear narratives.
It’s a subtle but crucial transition that compels us to ask...
When exactly does a drawing become design? And how does sketching influence the process of presenting data?
As the design director at Accurat, a data-driven research and design firm, I can, literally, illustrate how that process works most of the time.
The images below chronicle my company’s creation of an infographic published in Bright Ideas magazine.

The goal was to explore and visualize intriguing trends culled from all the independent movies that sold at the Sundance Film Festival between 2011 and 2013.
During the first phase, I don’t use real data. These rough sketches help me visualize the “architecture” of the infographic and cultivate ideas for shaping the data visually. At this point, I’m mostly interested in the big picture—the macro categories of the raw statistics that we’re analyzing, such as the number of awards per film and the correlations between each movie’s box office gross, sales price, and budget.
In creating data visualizations, a common approach among designers is to begin the process by using familiar tools and concepts. While this allows them to work within their comfort zone, it can also lead them to adopt the easiest, and maybe not the best, solution to represent important aspects of the information.

As opposite, when I am sketching to explore the dimensions of a dataset, I don’t have access to the actual data with my pen and paper, but only to it’s logical organizations, and this is an invaluable asset to focus on the meaning of information, and not on numbers out of context. Many times this self-imposed limit triggers new questions on the data itself; instead of being overwhelmed by the size of a dataset and by millions of numbers we only focus on its nature, and this often opens new possibilities and opportunities that origin from this vantage point of view.

Once I’m satisfied with the basic structure, I turn my focus toward the microelements—specific data points—to figure out which forms, colors and features we might adopt or invent to better represent them.

At this stage, drawing with data also can help raise new questions about the data itself: the emerging sketch sometimes reveals new opportunities for analysis that weren’t apparent when we were looking only at the numbers.
Lastly, we create a prototype of our visualization, either on paper or digitally, which brings all the elements together. This facilitates communication among the designers, researchers, and clients, allowing for final changes before producing the finished product.

Specifically, on this piece I worked with visual designer Michele Graffieti, and sketching was fundamental throughout all the steps: to get ideas through and to explore and evaluate possibilities even after we began stylizing the digital version.
Drawing becomes design when you start tracing lines, symbols and structures that enable you to rationalize thoughts and envision a possible solution to a problem.
In any context, it helps to freely navigate possibilities and to think without limitations and boundaries. It opens mental spaces where correlations can be made. When drawing morphs into design, it enables discovery.
Follow Giorgia Lupi on Twitter


