People-Powered Data Visualization
Through crowdsourcing and citizen science projects, the general public is making profound contributions to research. Can data visualization help make sense of this wealth of new information?
Data Points is a new series in which we explore the world of data visualization, information graphics, and cartography.
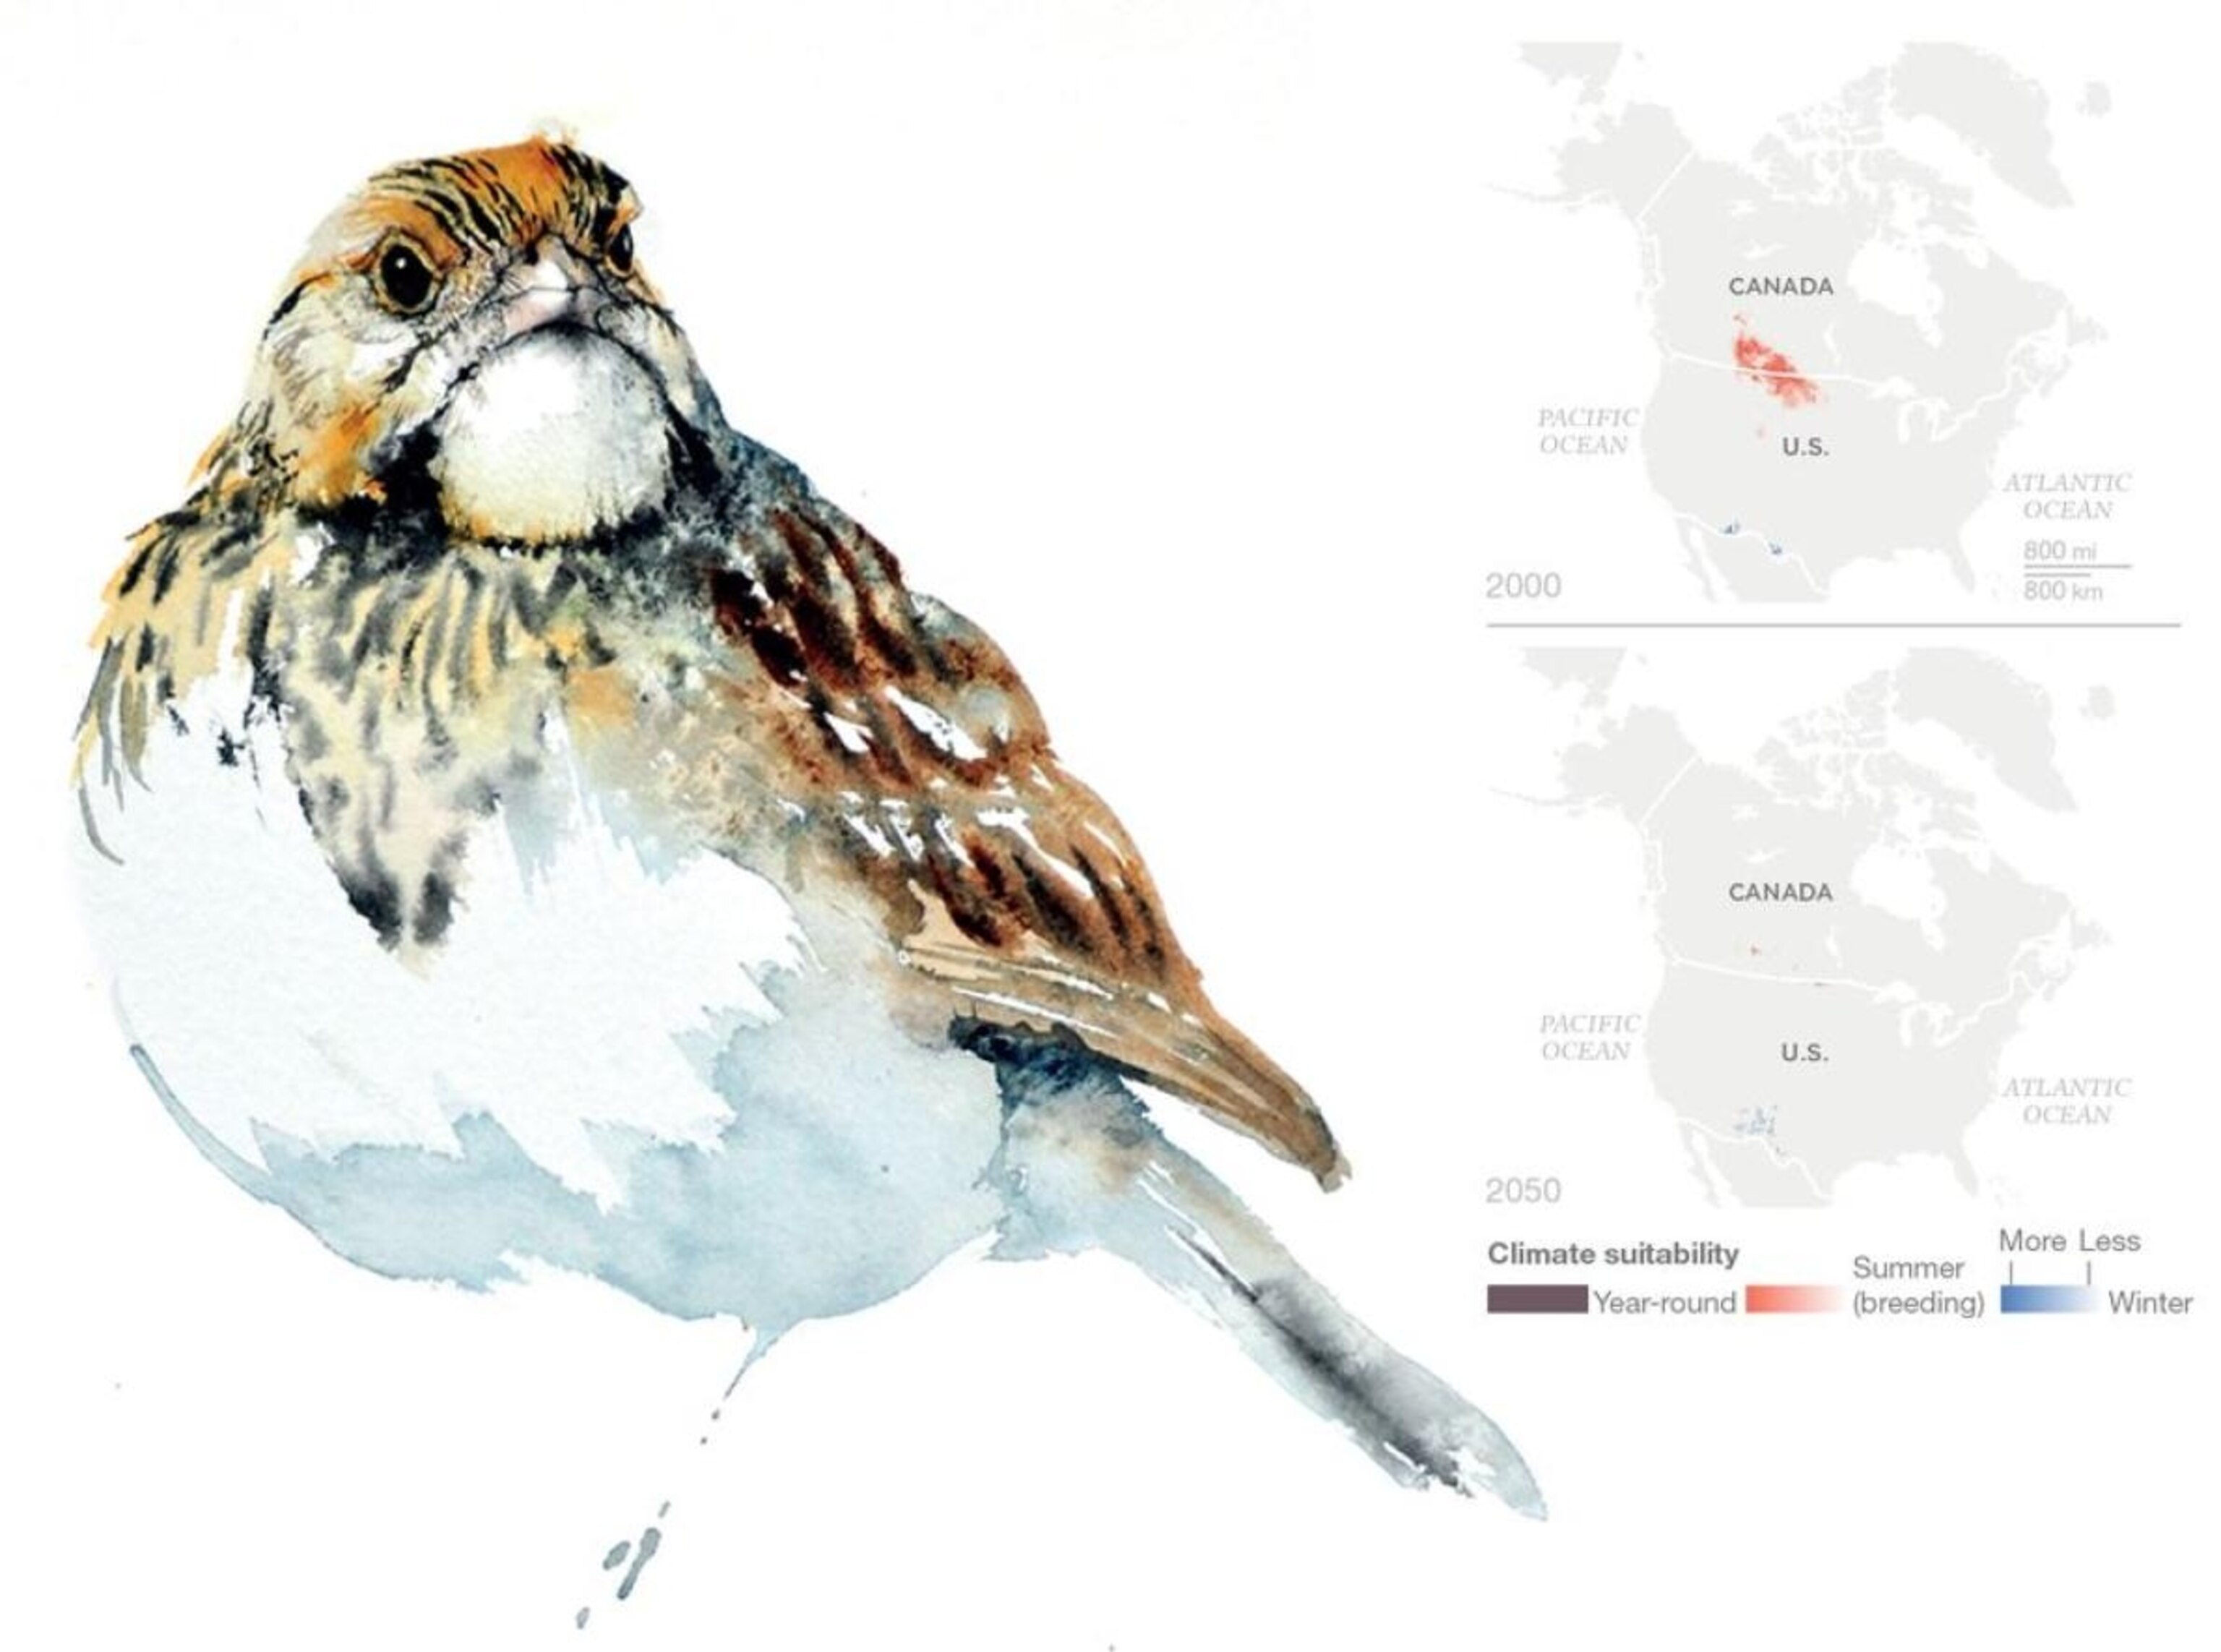
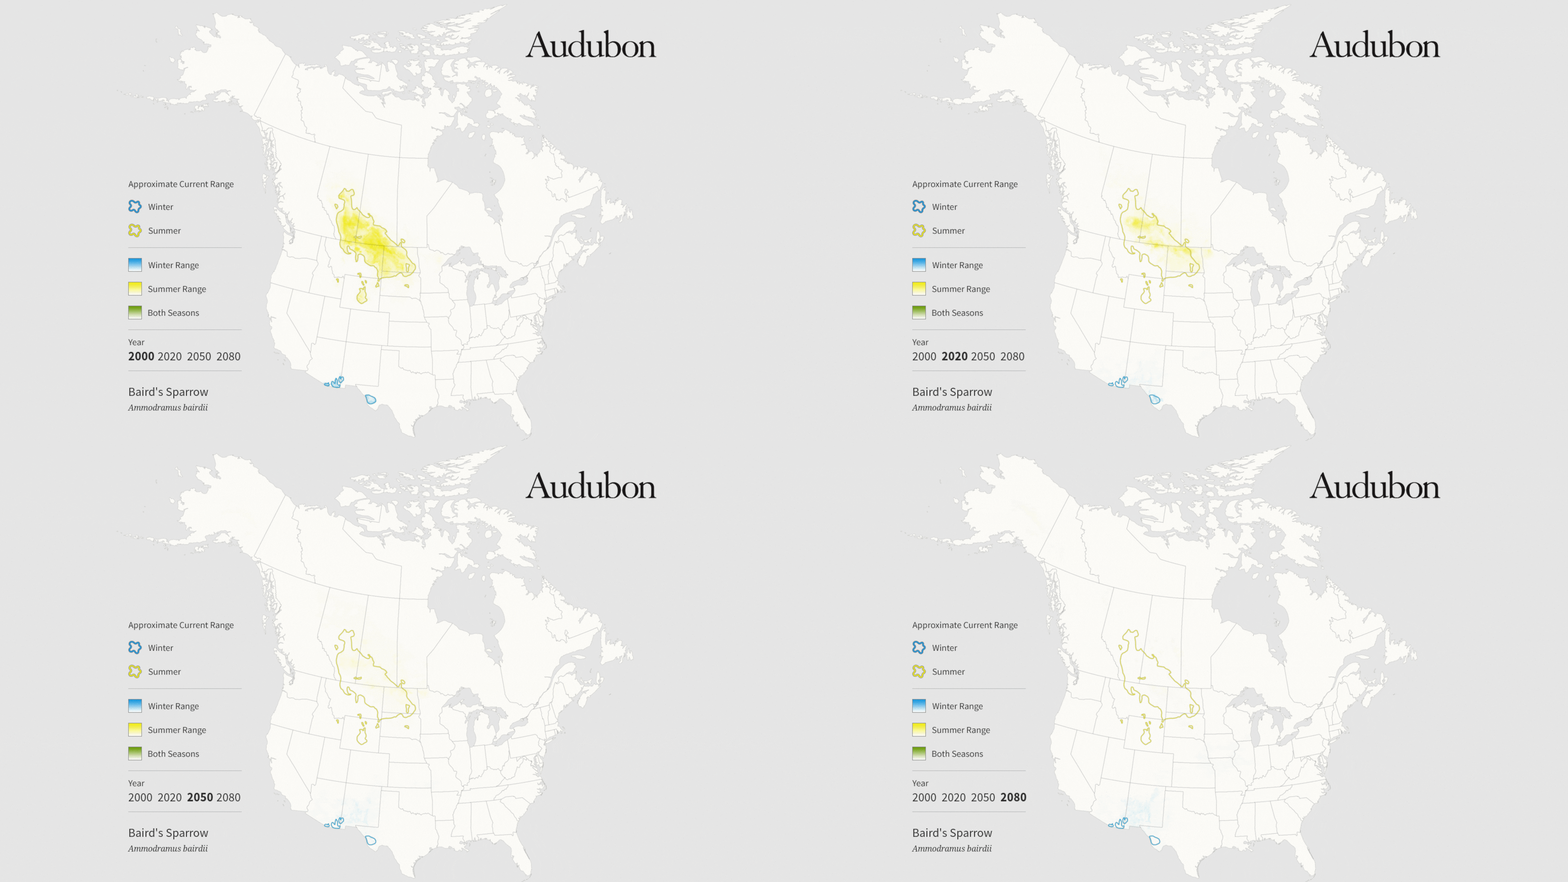
Last fall the National Audubon Society published an alarming report about the future of North American birds. Of the hundreds of species that they studied, more than half are threatened with extinction as a result of climate change. Accompanying the report was a series of animations, produced by the San Francisco firm Stamen Design, showing how each threatened bird's home range could shift over the next 65 years. Many of the maps showed suitable habitat drifting north in response to rising temperatures and in some cases disappearing. The breeding grounds of birds such as the eastern whip-poor-will and the Baird's sparrow, a tiny grassland bird native to the northern plains, may all but vanish.
One of the less talked about aspects of the Audubon report was its baseline data—observations about habitat ranges that had come from amateur bird-watchers.
Several news organizations, including National Geographic and the New York Times, published graphics of their own using the Audubon data, which came from a sophisticated analysis of global climate conditions. One of the less talked about aspects of the Audubon report was its baseline data—observations about habitat ranges that had come from amateur bird-watchers.

From Crowdsourcing to Citizen Science
The Audubon report reflects the rise of crowdsourcing, in which masses of private citizens contribute to collective projects. Thanks to smartphones, the Web, and cloud computing platforms, individuals around the world can help identify wild animals in safari parks, categorize the emotions evoked by literary excerpts, classify galaxies, or just draw pictures of sheep. When crowdsourcing extends beyond typically low-level validation tasks to more profound analytical contributions, it enters the realm of citizen science.

What is citizen science? "Observations of nature made by people who were not trained as scientists," says Mary Ellen Hannibal, author of the forthcoming book Citizen Scientist. By that measure, she says, "Even Darwin was a citizen scientist, because he was not affiliated with any institution. He didn't have higher degree—he had a bachelor's."
Even Darwin was a citizen scientist.Mary Ellen Hannibal, author of Citizen Scientist
Amid the fuss surrounding aerial drones, remote sensors, and the new satellite imagery that's coming online, it’s easy to forget the contributions that motivated and smartphone-equipped individuals can make to science, whether by hiding in bird blinds, splashing through tide pools, scaling mountain peaks, or sitting at a desk. "It's really incredible what satellites can do," says Hannibal, "but that information needs to be ground truthed." In bird-watching, she adds, "birds are hard to identify, and human eyeballs are still better at that."
An Old Idea Retooled
The bird surveys that informed the Audubon report have a surprisingly long history. The Christmas Bird Count dates back to 1900, when the ornithologist Frank Chapman persuaded hunters to count live birds instead of shooting them for sport. With tens of thousands of amateurs and many regional chapters contributing millions of observations each year, it is a complex undertaking.
The Christmas Bird Count dates back to 1900, when the ornithologist Frank Chapman persuaded hunters to count live birds instead of shooting them for sport.
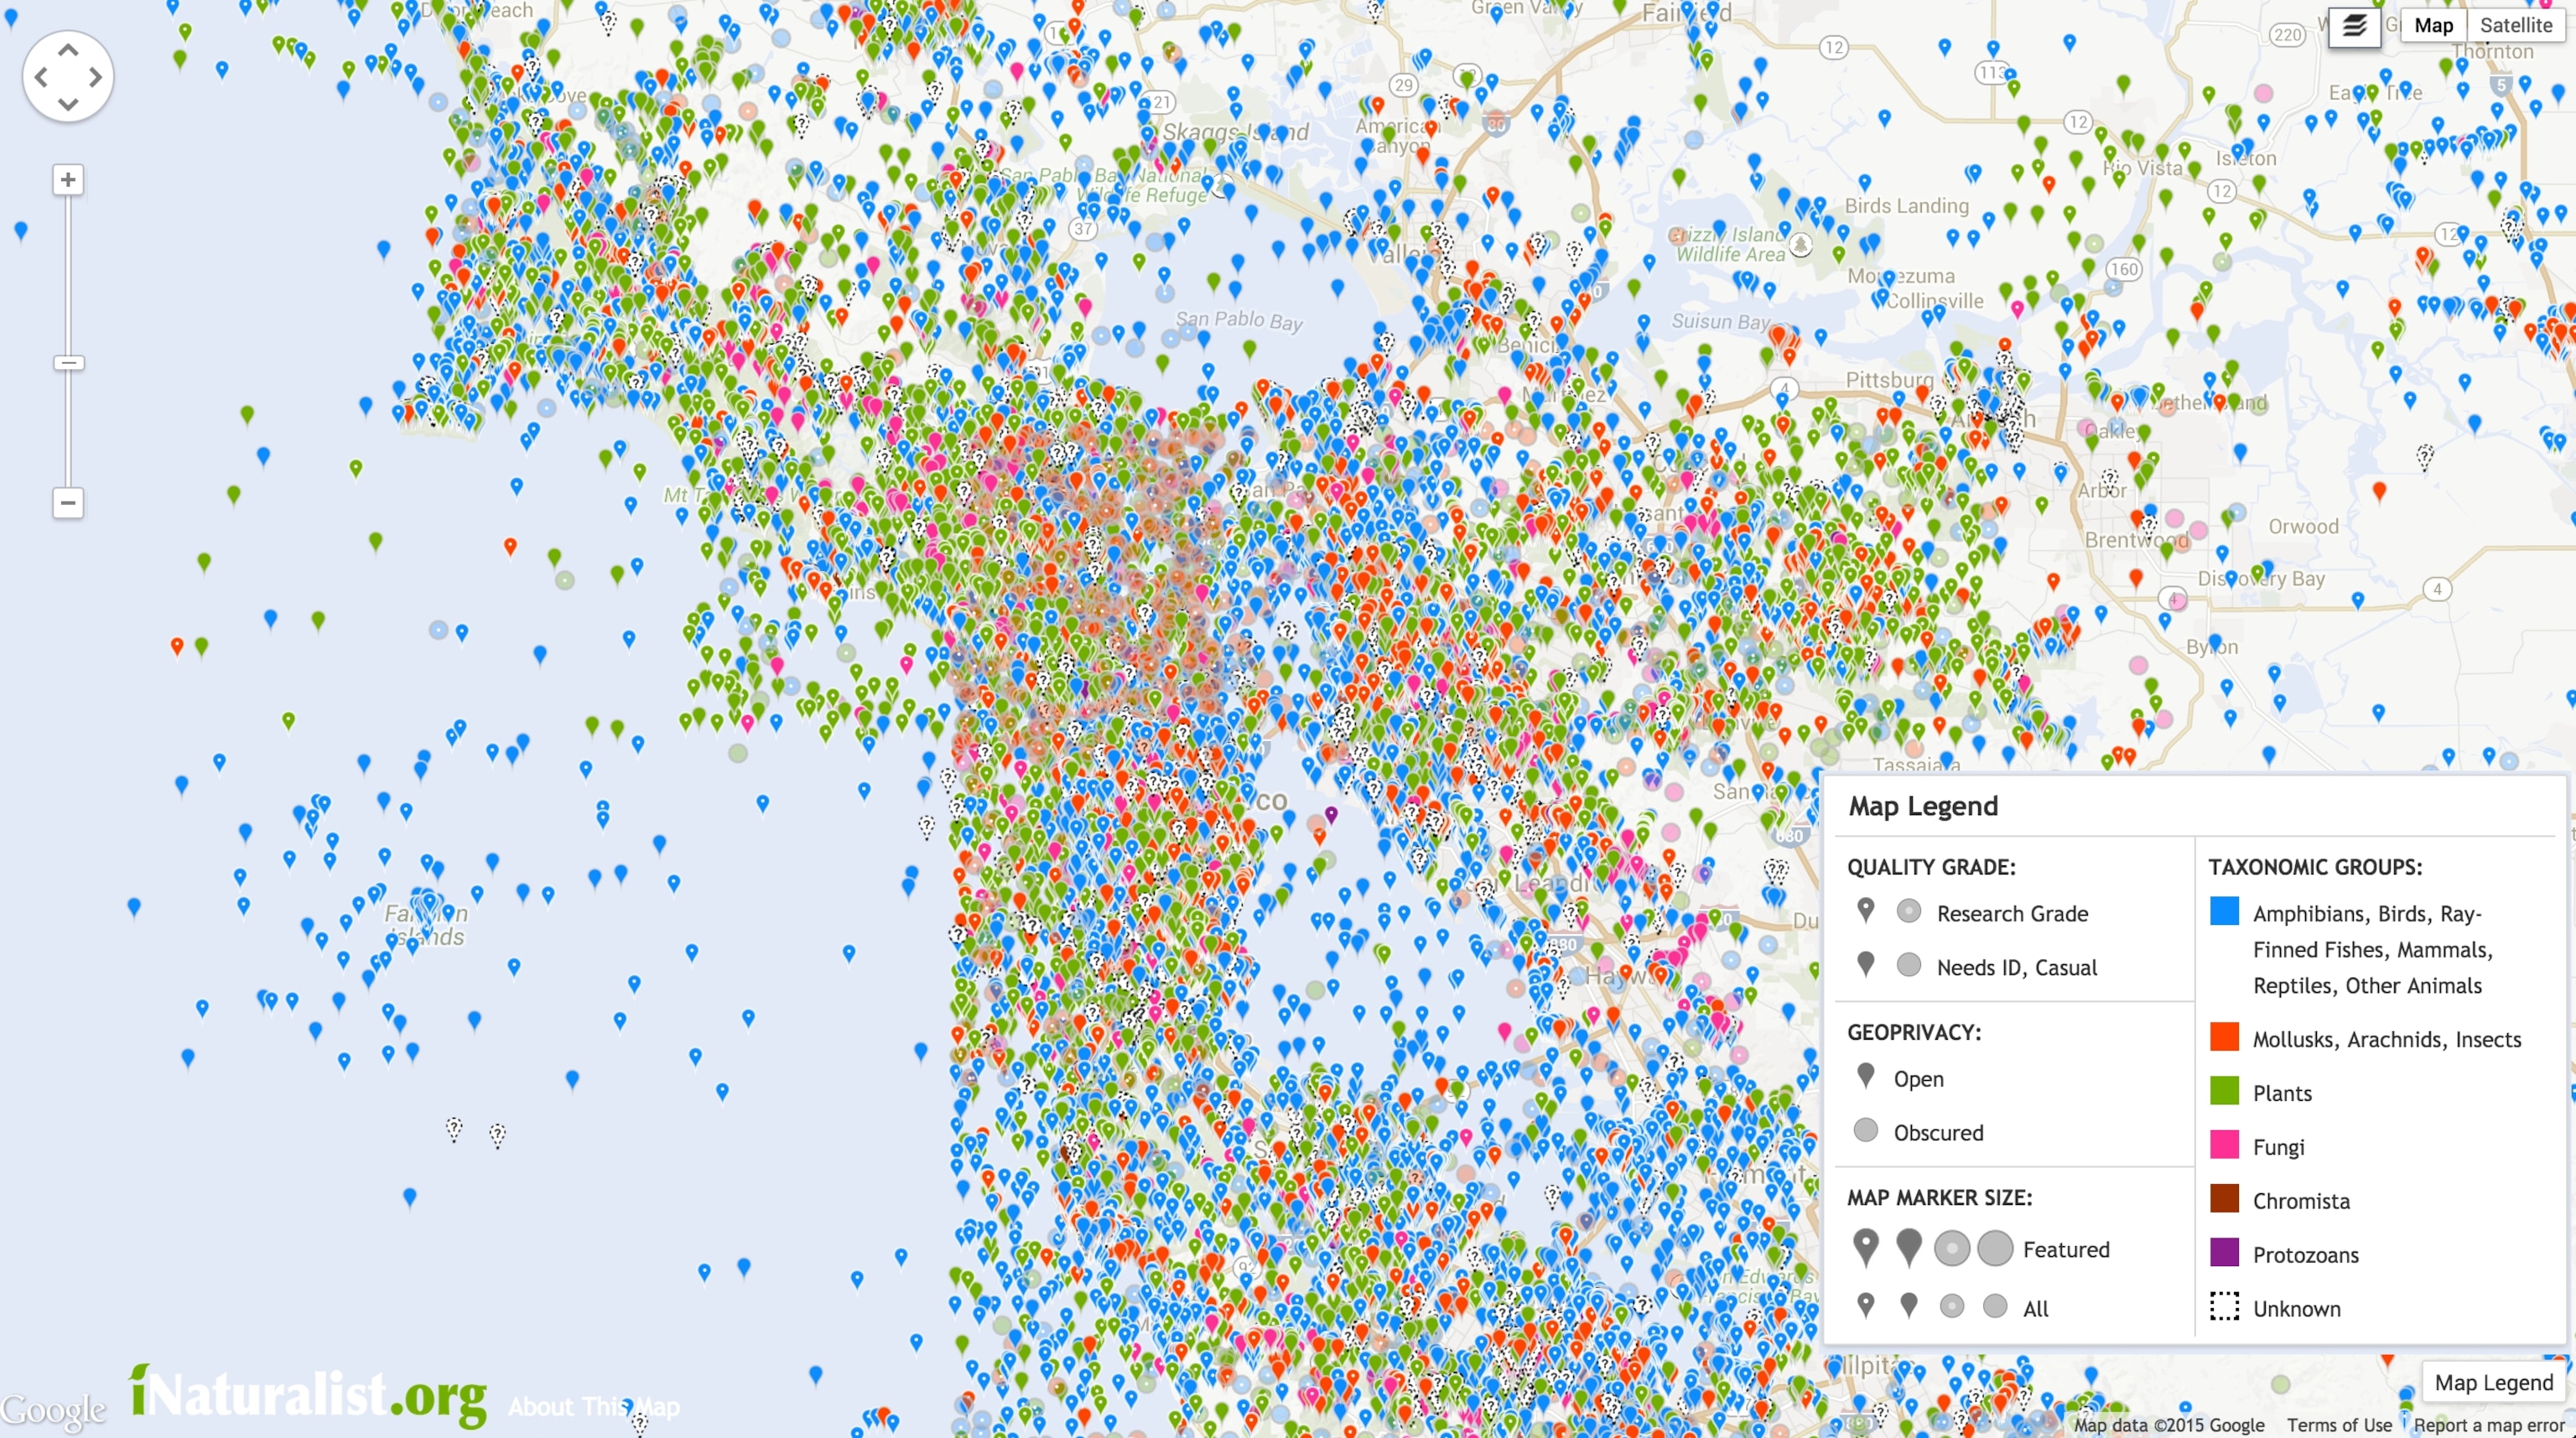
The next generation of citizen science platforms could be represented by the website and mobile app iNaturalist. Developed by graduate students at the University of California, Berkeley, and now operated by the California Academy of Sciences, iNaturalist passed its millionth contribution last fall. (Full disclosure: iNaturalist has partnered with National Geographic.) Registered users take a picture of a plant, animal, or bug; the smartphone then assigns a date, time, and location; the report is then uploaded. Once three designated experts agree on what the picture shows, it becomes a "museum grade" observation. Eventually the information is uploaded into the Global Biodiversity Information Facility, a data bank.
Unlike other citizen science hubs such as Cornell University's eBird and Zooniverse, the iNaturalist website isn't oriented strictly toward data visualization, but given the quantity of the submissions, visualization plays an important role. The iNaturalist website has a map showing all of the observations made since its inception; eBird has a similar map showing contributions in real time.

From Mapping Nuisances to Exploring the Mind
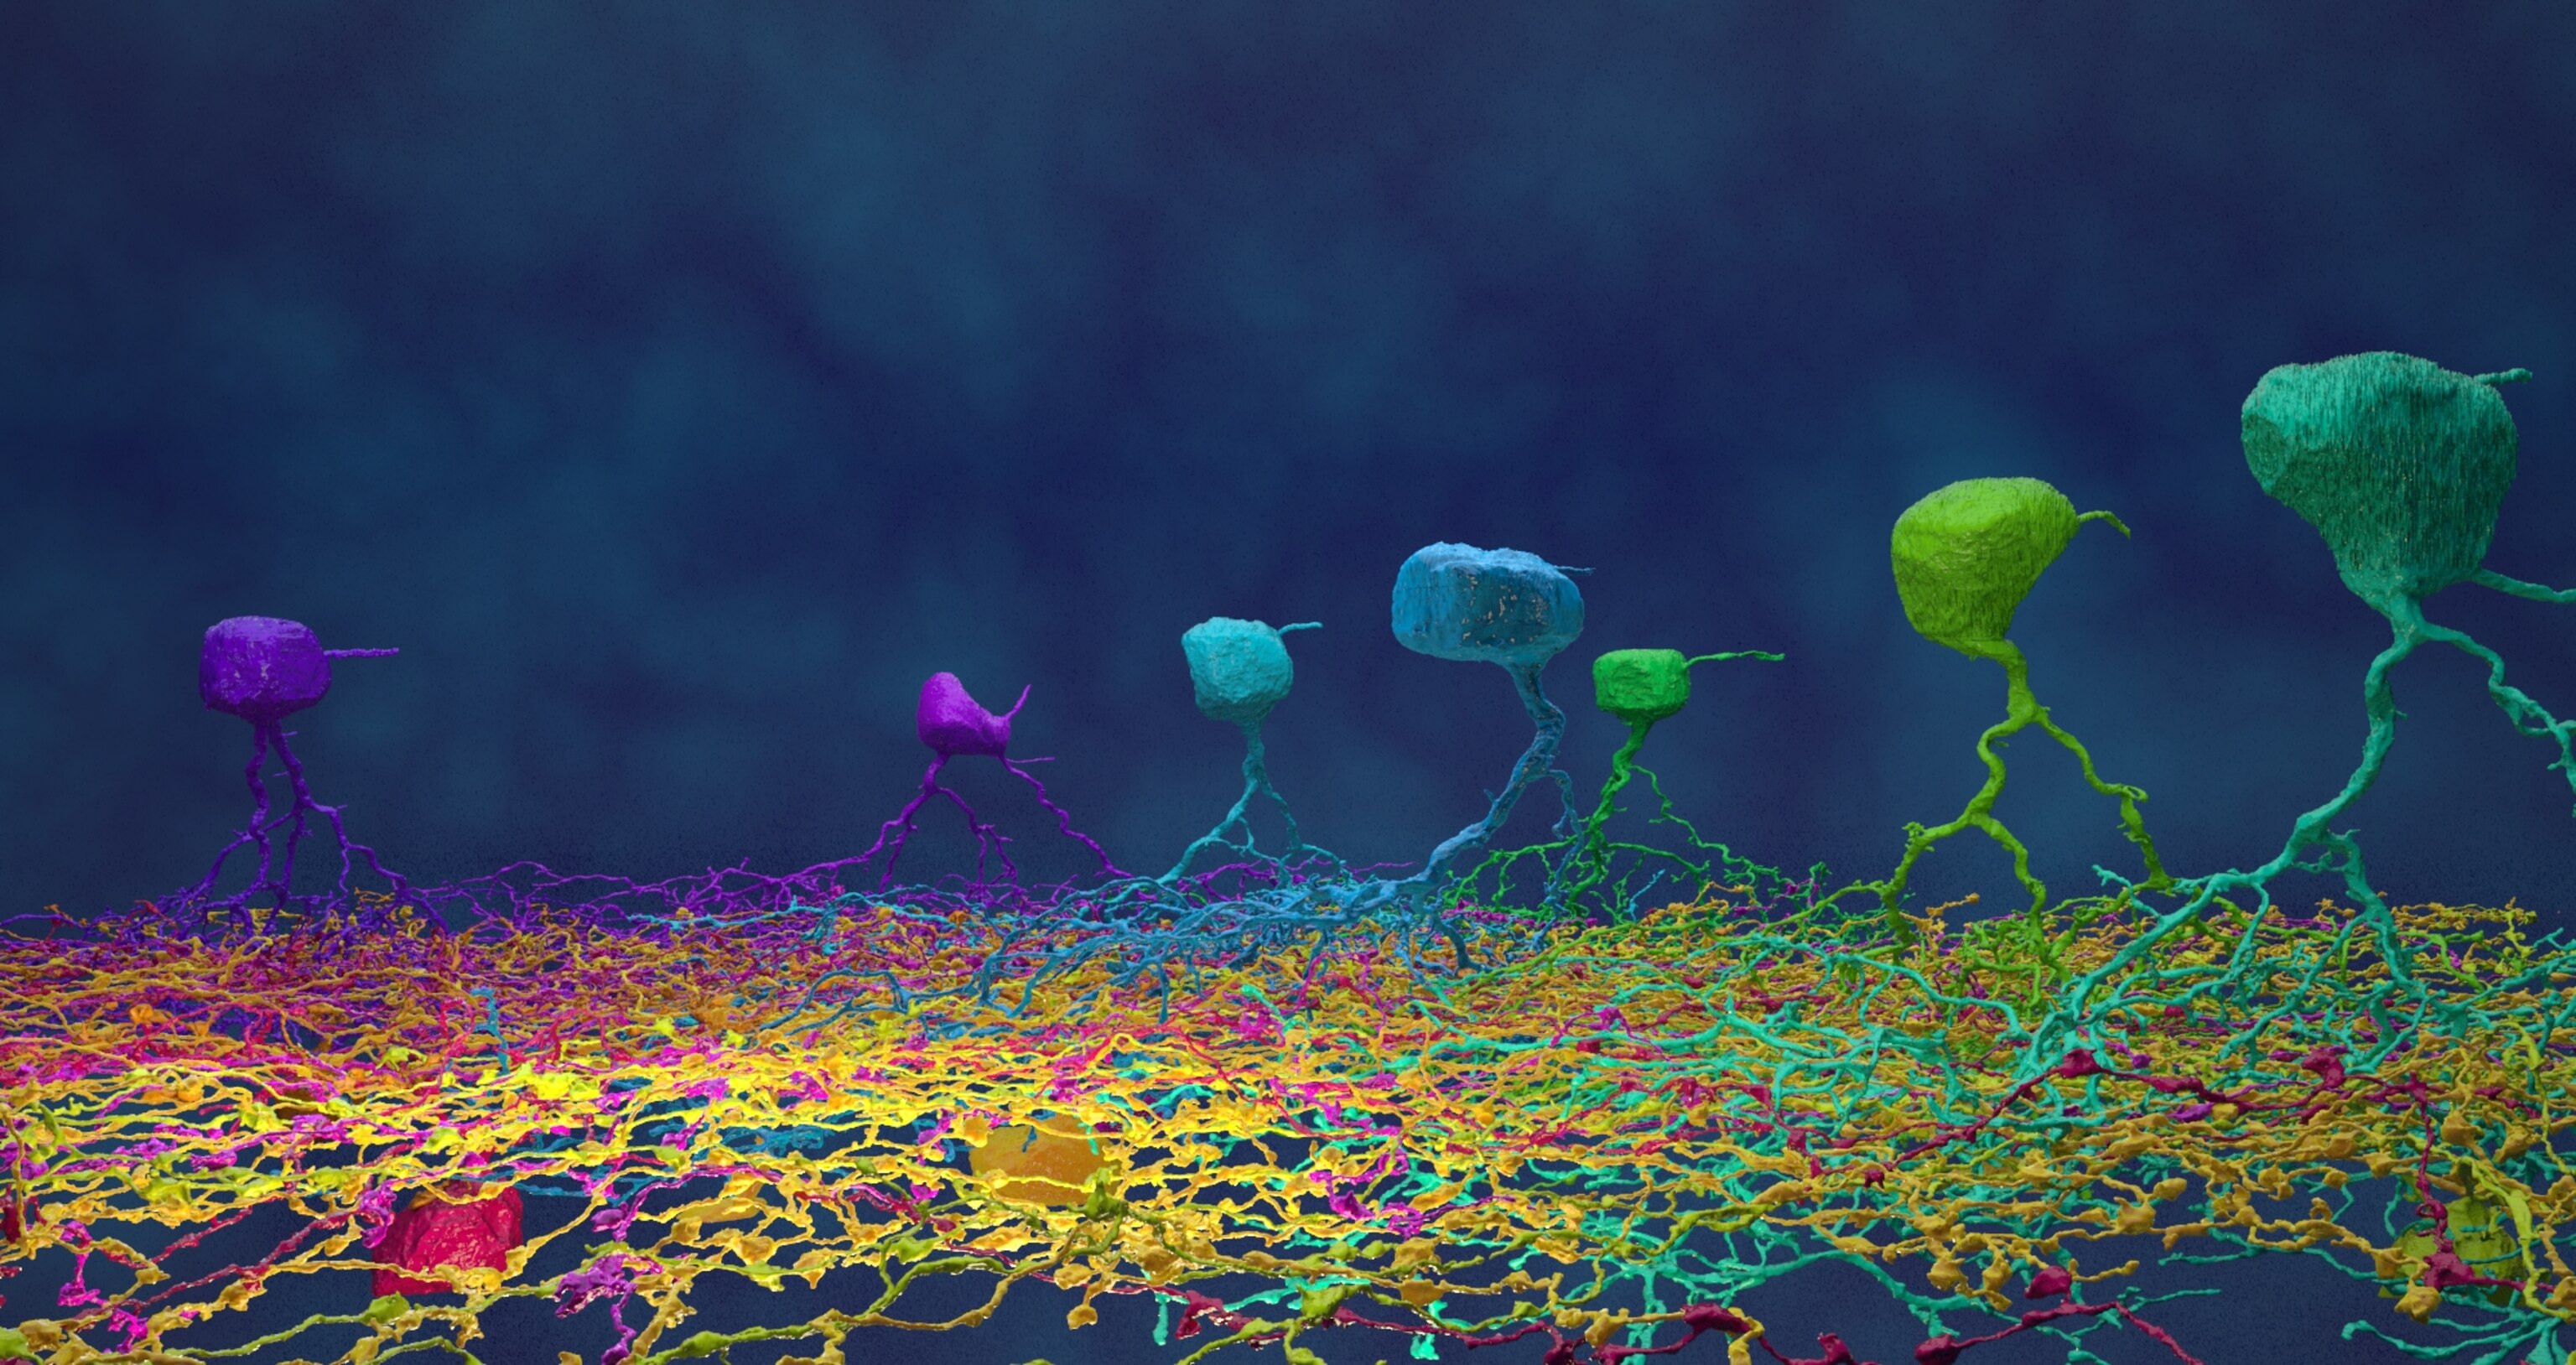
Smartphone-toting would-be citizen scientists have many other opportunities to contribute. A German app called Loss of the Night asks users to identify stars with their smartphone cameras as a way to measure light pollution. NOAA's marine debris tracker lets users pinpoint and report ocean flotsam and beach trash. A particularly innovative project is MIT's EyeWire, which makes a social game out of interpreting brain scans; the project has already produced striking three-dimensional images of neurons with the goal of mapping all of the mind's connections, its "connectome."

Citizen science projects are not just observational. Given that invasive species are believed to be a major driver of extinction, "co-creative" projects like the one run by Nature's Notebook (a USGS website) invite users to help eradicate weeds like bufflegrass, which can pose a fire threat to the Southwest's iconic saguaro cactus.
How to Get Involved
Websites that track and catalog citizen science projects include Zooniverse, SciStarter and Scientific American magazine's Citizen Science portal. There users can sign up to do behavioral research experiments with their babies, volunteer to wear air quality monitors, or anonymously report sexual activity through an app created by the venerable Kinsey Institute at Indiana University.
What’s next? The advent of wearable computers like fitness trackers and smartwatches is creating new citizen science opportunities, particularly in the area of public health. Along with these opportunities comes a rising challenge—how to deal with the flood of data generated. It’s here that data visualization may have the greatest potential to help make sense of all that we're collecting. “Big data and data visualization,” says Hannibal, “gives us the chance to make sense of the data points.” If so, the habitat we preserve may just be our own.
Follow Geoff McGhee on Twitter

